Scatter Plots - Quiz - Level H
Question 3
The scatter plot below shows the relationship...

Mathematics, 31.03.2020 20:42 ctyrector
Scatter Plots - Quiz - Level H
Question 3
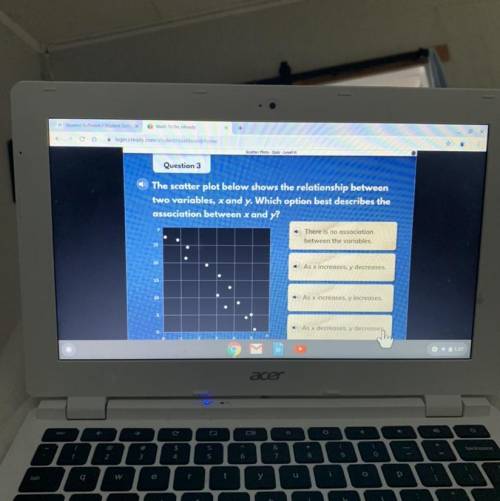
The scatter plot below shows the relationship between
two variables, x and y. Which option best describes the
association between x and y?
There is no association
between the variables.
As x increases, y decreases.
As x increases, y increases.
As x decreases, y decreases,

Answers: 3
Another question on Mathematics
Mathematics, 21.06.2019 16:30
Hi my sisters and brothers can tell me the answer because i don’t understand the question
Answers: 1
Mathematics, 21.06.2019 18:30
Two cyclists 84 miles apart start riding toward each other at the samen time. one cycles 2 times as fast as the other. if they meet 4 hours later what is the speed (in miles) of the faster cyclists
Answers: 2
Mathematics, 21.06.2019 20:20
Select the correct answer. what is the exact value of sin (157.5°)? a. 'sqrt(2 - sqrt(2))/2 b. *"-"'sqrt(2 + sqrt(2))/29 c.'sqrt(2 + sqrt(2))/4" d. "-"sqrt(2 + sqrt(2))/4)
Answers: 3
You know the right answer?
Questions


English, 16.03.2020 20:28

Mathematics, 16.03.2020 20:28

Mathematics, 16.03.2020 20:28


English, 16.03.2020 20:28

Spanish, 16.03.2020 20:28
History, 16.03.2020 20:28


