
Mathematics, 28.03.2020 04:01 anaalashay
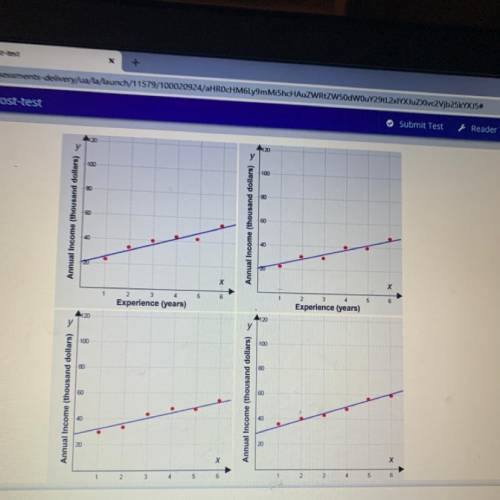
When David first got a job, his annual income was $20,000. He worked hard and got more experience. After 8 years, he realized that his
average increase in pay was about $4,000 every year. Which scatter plot represents this situation?
Annual Income (thousand dollars)
Annual Income (thousand dollars)
Experience (years)
Experience (years)
al Income (thousand dollars)
al Income (thousand dollars)

Answers: 3

Another question on Mathematics
Mathematics, 21.06.2019 22:10
What is the area of the original rectangle? 8 cm² 20 cm² 25 cm² 40 cm²
Answers: 1
Mathematics, 21.06.2019 23:00
Susie wants to take her friend out for lunch.she wants to spend $9.75 each person. how much will she spend in all.
Answers: 2
Mathematics, 22.06.2019 00:00
During the election for class president, 40% of the students voted for kellen, and 60% of the students voted for robbie. 500 students voted in total. how many more students voted for robbie than for kellen? answer with work : )
Answers: 1
You know the right answer?
When David first got a job, his annual income was $20,000. He worked hard and got more experience. A...
Questions

Mathematics, 16.04.2021 03:00

Health, 16.04.2021 03:00


History, 16.04.2021 03:00
Mathematics, 16.04.2021 03:00


Arts, 16.04.2021 03:00
Mathematics, 16.04.2021 03:00
Mathematics, 16.04.2021 03:00

English, 16.04.2021 03:00
Mathematics, 16.04.2021 03:00
Mathematics, 16.04.2021 03:00

Mathematics, 16.04.2021 03:00


