
Mathematics, 24.03.2020 03:52 pupucitomarron
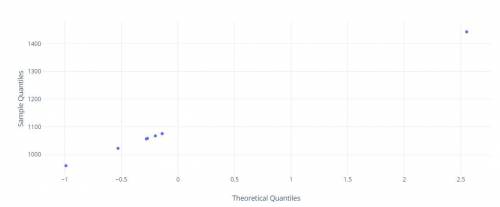
A sample of human brain volumes (cm3) is given below. Use the given data values to identify the corresponding z scores that are used for a normal quantile plot, then identify the coordinates of each point in the normal quantile plot. Construct the normal quantile plot, then determine whether the data appear to be from a population with a normal distribution. 1067 1075 1056 1022 1075 1443 959 1058 List the z scores for the normal quantile plot.

Answers: 3


Another question on Mathematics
Mathematics, 21.06.2019 18:40
What is the value of the expression below? 148+(-6)| + |– 35= 7|
Answers: 2
Mathematics, 21.06.2019 23:30
Petes dog weighed 30 pounds it then lost 16% of it's weight how much did pete lose
Answers: 2
Mathematics, 22.06.2019 00:20
Three students, javier, sam, and corrine, participated in a fundraiser where people donated a certain amount of money per lap that the student ran. each student also had some initial donations that were collected before the run. the equations that represent each student's total donation, y, based on the number of laps ran, x, is shown below. match each equation with the correct rate of change for that student.
Answers: 1
Mathematics, 22.06.2019 02:20
Find the volume of the wedge cut from the first octant by the cylinder z=12-3y^2 and the plane x+y=2.
Answers: 1
You know the right answer?
A sample of human brain volumes (cm3) is given below. Use the given data values to identify the corr...
Questions

Mathematics, 07.10.2020 18:01


History, 07.10.2020 18:01
Mathematics, 07.10.2020 18:01
History, 07.10.2020 18:01
Mathematics, 07.10.2020 18:01
History, 07.10.2020 18:01
Mathematics, 07.10.2020 18:01
Mathematics, 07.10.2020 18:01

Physics, 07.10.2020 18:01
Mathematics, 07.10.2020 18:01

Social Studies, 07.10.2020 18:01


