
Mathematics, 21.03.2020 07:35 hrijaymadathil
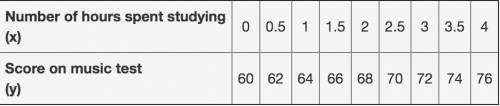
A teacher is assessing the correlation between the number of hours spent studying and the average score on a music test. The table shows the data (table is attached)
Number of hours spent studying
(x) 0 0.5 1 1.5 2 2.5 3 3.5 4
Score on music test
(y) 60 62 64 66 68 70 72 74 76
Part A: Is there any correlation between the number of hours students spent studying and the score on the music test? Justify your answer. (4 points)
Part B: Write a function that best fits the data. (3 points)
Part C: What does the slope and y-intercept of the plot indicate? (3 points)

Answers: 3

Another question on Mathematics
Mathematics, 21.06.2019 18:00
On a piece of paper, graph y< x+1. then determine which answer matches the graph you drew.
Answers: 2
Mathematics, 21.06.2019 19:00
Me with geometry ! in this figure, bc is a perpendicular bisects of kj. dm is the angle bisects of bdj. what is the measure of bdm? •60° •90° •30° •45°
Answers: 2
Mathematics, 21.06.2019 19:30
Abird on top of a 200 ft bridge tower sees a man standing on the lower part of the bridge (which is 50 ft above the ground). the angle of depression from the bird is 26 ̊. how far is the man from the base of the bridge tower? with explanation and pictures .
Answers: 1
You know the right answer?
A teacher is assessing the correlation between the number of hours spent studying and the average sc...
Questions

Mathematics, 14.05.2021 19:00
Mathematics, 14.05.2021 19:00

Mathematics, 14.05.2021 19:00
Mathematics, 14.05.2021 19:00
Mathematics, 14.05.2021 19:00
Mathematics, 14.05.2021 19:00

Chemistry, 14.05.2021 19:00
Mathematics, 14.05.2021 19:00
Mathematics, 14.05.2021 19:00
Mathematics, 14.05.2021 19:00


French, 14.05.2021 19:00


