Complete each of the following.
a. Graph each function by making a table of values.
b. D...

Mathematics, 20.03.2020 22:40 kaylatunell123
Complete each of the following.
a. Graph each function by making a table of values.
b. Determine the consecutive values of x between which each real zero is located.
c. Estimate the x-coordinates at which the relative maxima and minima occur.
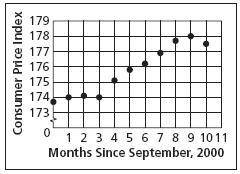
PRICES The Consumer Price Index (CPI) gives the relative price for a fixed set of goods and services. The CPI from September 2000 to July 2001 is shown in the graph.
Source: U. S. Bureau of Labor Statistics
a. Describe the turning points of the graph.
b. If the graph were modeled by a polynomial equation, what is the least degree the equation could have?

Answers: 2
Another question on Mathematics
Mathematics, 21.06.2019 13:40
John bought 5 lemons and used 2 of them for a salad how much did he use for.a salad . he used % of the lemons.
Answers: 2
Mathematics, 21.06.2019 19:00
Solve 3x-18=2y and 5x-6y=14 by elimination or substitution . show all !
Answers: 1
Mathematics, 21.06.2019 19:30
Which of the following transformations will always produce a congruent figure?
Answers: 2
You know the right answer?
Questions

Mathematics, 07.05.2021 05:10

Mathematics, 07.05.2021 05:10
Mathematics, 07.05.2021 05:10
Mathematics, 07.05.2021 05:10
Mathematics, 07.05.2021 05:10
Mathematics, 07.05.2021 05:10
Mathematics, 07.05.2021 05:10
Mathematics, 07.05.2021 05:10
SAT, 07.05.2021 05:10

History, 07.05.2021 05:10

Mathematics, 07.05.2021 05:10


