Solve x2 – StartFraction 16 Over 25 EndFraction = 0.
1. Isolate x2 : x2 = StartFraction...

Mathematics, 18.03.2020 12:22 bwright142
Solve x2 – StartFraction 16 Over 25 EndFraction = 0.
1. Isolate x2 : x2 = StartFraction 16 Over 25 EndFraction
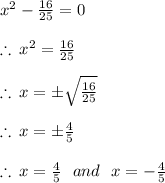
2. Apply the square root property of equality:
StartRoot x squared EndRoot = StartRoot StartFraction 16 Over 25 EndFraction EndRoot
What are the solutions of the equation?
x = StartFraction 4 Over 25 EndFraction and x = StartFraction negative 4 Over 25 EndFraction
x = StartFraction 8 Over 25 EndFraction and x = StartFraction negative 8 Over 25 EndFraction
x = StartFraction 16 Over 25 EndFraction and x = Start Fraction negative 16 Over 25 EndFraction
x = StartFraction 4 Over 5 EndFraction and x = StartFraction negative 4 Over 5 EndFraction

Answers: 3
Another question on Mathematics
Mathematics, 21.06.2019 16:00
Part one: measurements 1. measure your own height and arm span (from finger-tip to finger-tip) in inches. you will likely need some from a parent, guardian, or sibling to get accurate measurements. record your measurements on the "data record" document. use the "data record" to you complete part two of this project. name relationship to student x height in inches y arm span in inches archie dad 72 72 ginelle mom 65 66 sarah sister 64 65 meleah sister 66 3/4 67 rachel sister 53 1/2 53 emily auntie 66 1/2 66 hannah myself 66 1/2 69 part two: representation of data with plots 1. using graphing software of your choice, create a scatter plot of your data. predict the line of best fit, and sketch it on your graph. part three: the line of best fit include your scatter plot and the answers to the following questions in your word processing document 1. 1. which variable did you plot on the x-axis, and which variable did you plot on the y-axis? explain why you assigned the variables in that way. 2. write the equation of the line of best fit using the slope-intercept formula $y = mx + b$. show all your work, including the points used to determine the slope and how the equation was determined. 3. what does the slope of the line represent within the context of your graph? what does the y-intercept represent? 5. use the line of best fit to you to describe the data correlation.
Answers: 2
Mathematics, 21.06.2019 18:50
Find the greatest common factor of the followig monomials 21u^5v,3u^4v^6, and 3u^2v^5
Answers: 1
Mathematics, 21.06.2019 19:30
Runner ran 1 4/5 miles on monday and 6 3/10 on tuesday. how many times her monday’s distance was her tuesdays distance
Answers: 1
You know the right answer?
Questions
Mathematics, 18.02.2020 01:22
Mathematics, 18.02.2020 01:22


Mathematics, 18.02.2020 01:22

Mathematics, 18.02.2020 01:22
Mathematics, 18.02.2020 01:23


