
Mathematics, 17.03.2020 20:12 kaylam5599
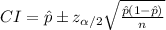
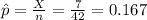
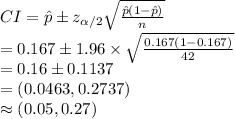
1. The data given below includes data from 42 candies, and 7 of them are red. The company that makes the candy claims that 33% of its candies are red. Use the sample data to construct a 95% confidence interval estimate of the percentage of red candies. What do you conclude about the claim of 33%?
2. Construct a 95 % confidence interval estimate of the population percentage of candies that are red.
Weights (g) of a Sample Bag of Candy
Red Blue Brown Green Yellow
0.792 0.982 0.765 0.738 0.837
0.942 0.769 0.745 0.823 0.719
0.906 0.997 0.897 0.729 0.796
0.941 0.877 0.816 0.866 0.712
0.959 0.788 0.902 0.792 0.704
0.976 0.965 0.956 0.983
0.809 0.999 0.846
0.849 0.986 0.834
0.955 0.845
0.736
0.721

Answers: 2

Another question on Mathematics
Mathematics, 21.06.2019 15:00
Abag contains 3 red marbles 4 white marbles and 5 blue marbles if one marble is drawn from the bag what is the probability that the marble will be blue
Answers: 1
Mathematics, 21.06.2019 18:00
Solve this and show you’re work step by step ! -5 3/4+3h< 9 1/4 -
Answers: 1
You know the right answer?
1. The data given below includes data from 42 candies, and 7 of them are red. The company that makes...
Questions

Computers and Technology, 21.10.2020 01:01

Mathematics, 21.10.2020 01:01
Mathematics, 21.10.2020 01:01

Mathematics, 21.10.2020 01:01

Mathematics, 21.10.2020 01:01

History, 21.10.2020 01:01


English, 21.10.2020 01:01


