
Mathematics, 17.03.2020 18:23 jessicachichelnitsky
A sample of 200 ROM computer chips was selected on each of 30 consecutive days, and the number of nonconforming chips on each day was as follows: 8, 19, 27, 17, 38, 18, 4, 27, 9, 22, 30, 17, 14, 23, 15, 14, 12, 20, 13, 18, 14, 20, 9, 27, 30, 13, 10, 19, 12, 26. Construct a p chart and examine it for any out-of-control points. (Round your answers to four decimal places.)
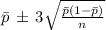
p =
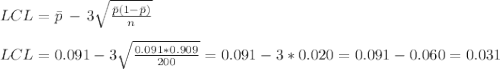
LCL =
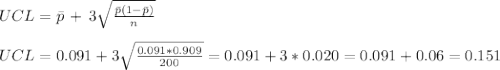
UCL=
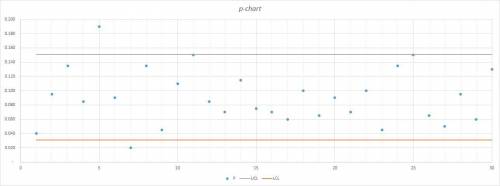
Comment on the chart.
The value of s on the 5th day lies below the LCL, so an out-of-control signal is generated.
The value of s on the 5th day lies above the UCL, so an out-of-control signal is generated.
Most points are between these limits, so the process appears to be in control with respect to variability.
All points are between these limits, so the process appears to be in control.
All points are between these limits, so the process appears to be out of control.

Answers: 2

Another question on Mathematics
Mathematics, 21.06.2019 14:40
3× __ -2=15 7 2× __+1=7 5 7× =22 15 5× __+10=2 8 × __+4=20 6 × =10 3 × __+2=8 6 × __+8=8 9 × __+7=20 6
Answers: 3
Mathematics, 21.06.2019 15:50
Assemble the proof by dragging tiles to the statements and reasons column
Answers: 2
Mathematics, 21.06.2019 20:30
Sketch the region enclosed by the given curves. decide whether to integrate with respect to x or y. draw a typical approximating rectangle and label its height and width. y= 5x, y=7x^2then find the area s of the region.
Answers: 3
You know the right answer?
A sample of 200 ROM computer chips was selected on each of 30 consecutive days, and the number of no...
Questions
Mathematics, 29.06.2020 14:01
Mathematics, 29.06.2020 14:01

Physics, 29.06.2020 14:01
Mathematics, 29.06.2020 14:01
Mathematics, 29.06.2020 14:01


Health, 29.06.2020 14:01
Physics, 29.06.2020 14:01
Mathematics, 29.06.2020 14:01
Mathematics, 29.06.2020 14:01
Mathematics, 29.06.2020 14:01

Biology, 29.06.2020 14:01


