
Mathematics, 16.03.2020 20:09 salinasroel22
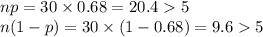
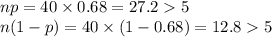
Consider a population proportion p = 0.68. a-1. Calculate the expected value and the standard error of P− with n = 30. (Round "expected value" to 2 decimal places and "standard deviation" to 4 decimal places.) a-2. Is it appropriate to use the normal distribution approximation for P− ? Yes No b-1. Calculate the expected value and the standard error of P− with n = 40. (Round "expected value" to 2 decimal places and "standard deviation" to 4 decimal places.) b-2. Is it appropriate to use the normal distribution approximation for P− ?

Answers: 3


Another question on Mathematics
Mathematics, 21.06.2019 13:30
Linet passes through (4.5) and is perpendicular to the line shown on the condirate grid.what is the equation of line t in standard form?
Answers: 1
Mathematics, 21.06.2019 19:30
If chord ab is congruent to chord cd, then what must be true about ef and eg?
Answers: 1
Mathematics, 21.06.2019 20:10
Look at the hyperbola graphed below. the hyperbola gets very close to the red lines on the graph, but it never touches them. which term describes each of the red lines? o o o o a. asymptote b. directrix c. focus d. axis
Answers: 3
Mathematics, 21.06.2019 20:30
26) -2(7x) = (-2 • 7) x a. associative property of addition b. associative property of multiplication c. commutative property of multiplication d. commutative property of addition
Answers: 1
You know the right answer?
Consider a population proportion p = 0.68. a-1. Calculate the expected value and the standard error...
Questions

Social Studies, 06.05.2020 00:42
Mathematics, 06.05.2020 00:42


History, 06.05.2020 00:42

Mathematics, 06.05.2020 00:42
Mathematics, 06.05.2020 00:42
Social Studies, 06.05.2020 00:42

Chemistry, 06.05.2020 00:42


