
Mathematics, 13.03.2020 19:54 damienwoodlin6
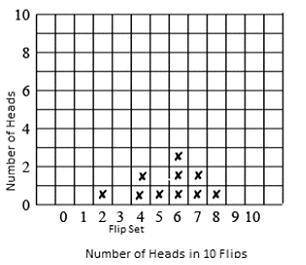
1. Draw a histogram from all the data. Starting at the bottom row, for each set of 10 flips, place an “x” in the column corresponding to the number of heads that set produced. Your histogram should look similar to the example below:
2. Calculate the mean and standard deviation.
mean = _, standard deviation = _
3. Calculate the percent of the data that is within 1, 2, and 3 standard deviations of the mean.
within 1 standard deviation = _%
within 2 standard deviations = _%
within 3 standard deviations = _%
4. Compare your results to a normal distribution. Interpret any differences.

Answers: 2
Another question on Mathematics
Mathematics, 21.06.2019 16:30
Solve the equation w^3 = 1,000 i honestly dont know how to punch this into a calculator pls
Answers: 1
Mathematics, 21.06.2019 23:20
6cm10 cma conical paper cup has dimensions as shown in the diagram. how much water can the cup hold when full?
Answers: 1
Mathematics, 21.06.2019 23:40
Determine the standard form of the equation of the line that passes through (-2,0) and (8,-5)
Answers: 1
You know the right answer?
1. Draw a histogram from all the data. Starting at the bottom row, for each set of 10 flips, place a...
Questions
Mathematics, 04.03.2021 01:00

History, 04.03.2021 01:00


Mathematics, 04.03.2021 01:00
Mathematics, 04.03.2021 01:00

English, 04.03.2021 01:00
Mathematics, 04.03.2021 01:00
English, 04.03.2021 01:00


