
Mathematics, 10.03.2020 02:09 bailee37
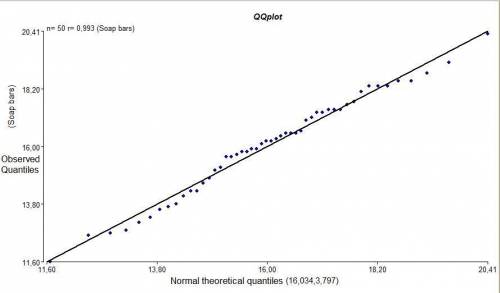
As part of a quality-control study aimed at improving a production line, the weights (in ounces) of 50 bars of soaps are measured. The results are as follows, sorted from smallest to largest.
11.6 12.6 12.7 12.8 13.1 13.3 13.6 13.7 13.8 14.1
14.3 14.3 14.6 14.8 15.1 15.2 15.6 15.6 15.7 15.8
15.8 15.9 15.9 16.1 16.2 16.2 16.3 16.4 16.5 16.5
16.5 16.6 17.0 17.1 17.3 17.3 17.4 17.4 17.4 17.6
17.7 18.1 18.3 18.3 18.3 18.5 18.5 18.8 19.2 20.3
Required:
Construct a normal probability plot for these data. Do the data appear to come from an approximately normal distribution?

Answers: 2
Another question on Mathematics
Mathematics, 21.06.2019 14:50
What is the square root of 45? (step by step working plz)
Answers: 1
Mathematics, 21.06.2019 19:00
What are the first 4 terms in the multiplication pattern given by the formula 2×4n
Answers: 1
Mathematics, 22.06.2019 00:00
If two parallel lines are cut by a transversal, interior angles on the same side of the transversal are supplementary. a. always b. sometimes c. never
Answers: 2
You know the right answer?
As part of a quality-control study aimed at improving a production line, the weights (in ounces) of...
Questions


History, 20.01.2022 01:00


Mathematics, 20.01.2022 01:00


Social Studies, 20.01.2022 01:00

Mathematics, 20.01.2022 01:00

Computers and Technology, 20.01.2022 01:00


