
Mathematics, 04.03.2020 05:00 jellybellyje
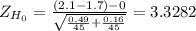
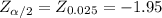
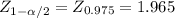
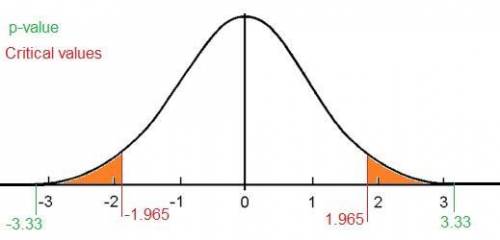
Researchers wanted to compare the effectiveness of a water softener used with a filtering process with a water softener used without filtering, Ninety locations were randomly divided into two groups of equal size. Group A locations used a water softener and the filtering process, while group B used only the water softener. At the end of three months, a water sample was tested at each location for its level of softness. (Water softness was measured on a scale of 1 to 5, with 5 being the softest water.) The results were as follows. x1-2.1 s1-0.7 x2-1.7 82 0.4 State the null and alternate hypothesis. Graph and shade the critical region. Find the critical value, the point estimate for the difference in population means given by these samples, and it's test statistic. Label these values and areas on your graph above. Find and explain the meaning of the P-value. Shade a graph showing the area equal to the p-value. Clearly state your initial and final conclusion

Answers: 3
![Z= \frac{(X[bar]₁ - X[bar]₂)-(Mu_1-Mu_2)}{\sqrt{\frac{S_1^2}{n_1} +\frac{S_2^2}{n_2} } }](/tpl/images/0533/3852/18c55.png)
Another question on Mathematics
Mathematics, 21.06.2019 16:20
Consider the function y = f(x)=3^x the values of f(1/2) and f(1/4). rounded to the nearest hundredth, are__and__ respectively
Answers: 3
Mathematics, 21.06.2019 23:00
Apackage of orgainc strwberries costs $1.50 while there in season and $2.25 when not in season what the percent increase
Answers: 1
You know the right answer?
Researchers wanted to compare the effectiveness of a water softener used with a filtering process wi...
Questions

Mathematics, 13.10.2020 04:01


Chemistry, 13.10.2020 04:01

Mathematics, 13.10.2020 04:01
Mathematics, 13.10.2020 04:01
Biology, 13.10.2020 04:01


Social Studies, 13.10.2020 04:01
Mathematics, 13.10.2020 04:01


