
Mathematics, 28.02.2020 19:56 zitterkoph
Question #1: A dance school has 54 students who learn salsa, and 23 of those students also learn ballet. There are 15 students who do not learn salsa but learn ballet, and 10 students do not learn either salsa or ballet. Which table best shows the conditional relative frequency of rows for the data?
A.
Learn salsa Do not learn salsa Total
Learn ballet 0.29 0.19 1
Do not learn ballet 0.39 0.13 1
Total 0.68 0.32 1
B.
Learn salsa Do not learn salsa Total
Learn ballet 0.61 0.39 1
Do not learn ballet 0.76 0.24 1
Total 0.68 0.32 1
C.
Learn salsa Do not learn salsa Total
Learn ballet 0.43 0.60 1
Do not learn ballet 0.57 0.4 1
Total 0.68 0.32 1
D.
Learn salsa Do not learn salsa Total
Learn ballet 0.23 0.15 1
Do not learn ballet 0.31 0.10 1
Total 0.54 0.25 1
Question #2: The box plots show the math scores of students in two different classes:
box plot for Class A has minimum value equal to 55, lower quartile equal to 73, median equal to 75, upper quartile equal to 89 and maximum value equal to 95. Box plot for Class B has minimum value equal to 65, lower quartile equal to 70, median equal to 75, upper quartile equal to 92.5 and maximum value equal to 100
Based on the box plots, which statement is correct?
A. The median score of Class A is greater than the median score of Class B.
B. The lower quartile of Class A is greater than the lower quartile of Class B.
C. The upper quartile of Class A is greater than the upper quartile of Class B.
D. The maximum score of Class A is greater than the maximum score of Class B.
Question #3:
A study analyzed the average yearly salt intake in the United States from 2012 thru 2017. The data is summarized in the table:
Year Annual Salt Intake
(grams)
2012 3,618
2013 3,646
2014 3,680
2015 3,716
2016 3,751
2017 3,790
The study found that the data after the year 2012 can be modeled by the function f(x) = 36.4x + 3,608, where x is the number of years since 2012 and f(x) is the total amount of salt ingested in grams. Describe the significance of 3,608.
A. The average amount of salt in grams used in 2013
B. The average amount of salt in grams used in 2012
C. An estimate of the average grams of salt used in 2013
D. An estimate of the average grams of salt used in 2012
Question #4: The following data show the scores Gina obtained on 12 IQ tests:
93, 83, 74, 74, 83, 92, 93, 94, 90, 87, 83, 86
The box plot represents the data:
box plot has minimum value equal to 74, lower quartile equal to 83, median equal to 86.5, upper quartile equal to 89 and maximum value equal to 94
Which of the following is shown incorrectly in the box plot?
A. Median
B. Lower quartile
C. Upper quartile
D. Maximum value
Question #5:
Make a conditional relative frequency table for the columns of movie type. Determine which statement has the strongest association.
Do you prefer watching a comedy, a drama, or a thriller movie?
Comedy Drama Thriller Row Totals
Males 35 12 75 122
Females 46 65 18 129
Column Totals 81 77 93 251
A. Males prefer comedy movies.
B. Females prefer drama movies.
C. Males prefer thriller movies.
D. Females prefer thriller movies.
Question #6:
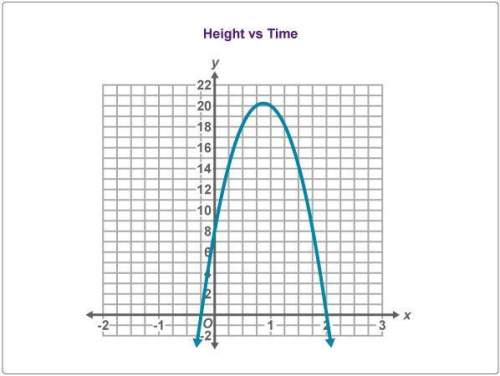
Given the scatter plot, choose the function that best fits the data.
scatter plot with data points that form an upward curve staring at the origin and continuing to the right
A. f(x) = 2x
B. f(x) = 2x
C. f(x) = −2x
D. f(x) = 2x2

Answers: 3
Another question on Mathematics
Mathematics, 21.06.2019 23:30
Astudent must have an average on five test that is greater than it equal to 80% but less than 90% to receive a final grade of b. devon's greades on the first four test were 78% 62% 91% and 80% what range if grades on the fifth test would give him a b in the course? ( assuming the highest grade is 100%)
Answers: 1
Mathematics, 22.06.2019 00:30
What is the value of x? enter your answer in the box. x =
Answers: 1
Mathematics, 22.06.2019 02:00
Which is the best estimate of the product of 0.9 x 0.88? 0 0.25 0.5 1
Answers: 2
Mathematics, 22.06.2019 02:40
Kilgore trout creates a new scale to diagnose depression. however, his scale only assesses one symptom of depression while ignoring others. which of the following is his new scale most likely lacking? a) test-retest reliability b) discriminant validity c) criterion validity d) alternate-forms reliability e) content validity f) none of the above
Answers: 1
You know the right answer?
Question #1: A dance school has 54 students who learn salsa, and 23 of those students also learn bal...
Questions

Computers and Technology, 06.06.2020 15:57


English, 06.06.2020 15:57
English, 06.06.2020 15:57


Biology, 06.06.2020 15:57


Chemistry, 06.06.2020 15:57


