
Mathematics, 28.02.2020 03:43 BeautyxQueen
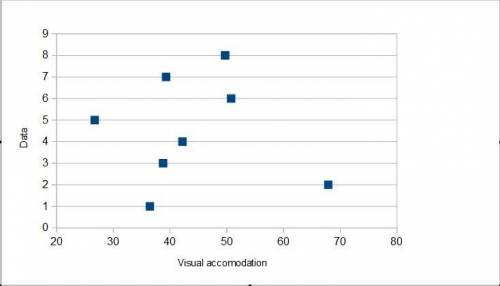
An article in Human Factors (June 1989) presented data on visual accommodation (a function of eye movement) when recognizing a .speckle pattern on a high-resolution CRT screen. The data are as follows: 36.45, 67.90. 38.77. 42.18, 26.72, 50.77, 39.30, and 49.71. Calculate the sample average and sample standard deviation. Construct a dot diagram of the data.

Answers: 2
![\frac{1}{n-1}*[sumX^2-\frac{(sumX)^2}{n} ]](/tpl/images/0527/6579/26a1a.png)
![\frac{1}{7}*[16528.40-\frac{(351.80)^2}{8} ]](/tpl/images/0527/6579/8d5d4.png)
Another question on Mathematics
Mathematics, 21.06.2019 18:00
Four congruent circular holes with a diameter of 2 in. were punches out of a piece of paper. what is the area of the paper that is left ? use 3.14 for pi
Answers: 1
Mathematics, 21.06.2019 19:30
Bobby bought 1.12 pounds of turkey at a cost of 2.50 per pound. carla bought 1.4 pounds of turkey at a cost of 2.20 per pound. who spent more and by much?
Answers: 2
Mathematics, 21.06.2019 19:40
Which of the following three dimensional figures has a circle as it’s base
Answers: 2
Mathematics, 21.06.2019 20:30
Steve had 48 chocolates but he decided to give 8 chocolats to each of his f coworkers. how many chocolates does steve have left
Answers: 1
You know the right answer?
An article in Human Factors (June 1989) presented data on visual accommodation (a function of eye mo...
Questions

Mathematics, 17.02.2021 09:50

English, 17.02.2021 09:50
Mathematics, 17.02.2021 09:50

Geography, 17.02.2021 09:50

Computers and Technology, 17.02.2021 09:50
Mathematics, 17.02.2021 09:50

Arts, 17.02.2021 09:50
Geography, 17.02.2021 09:50

Business, 17.02.2021 09:50
Mathematics, 17.02.2021 09:50
Mathematics, 17.02.2021 09:50
Mathematics, 17.02.2021 09:50
Mathematics, 17.02.2021 09:50
Mathematics, 17.02.2021 09:50


