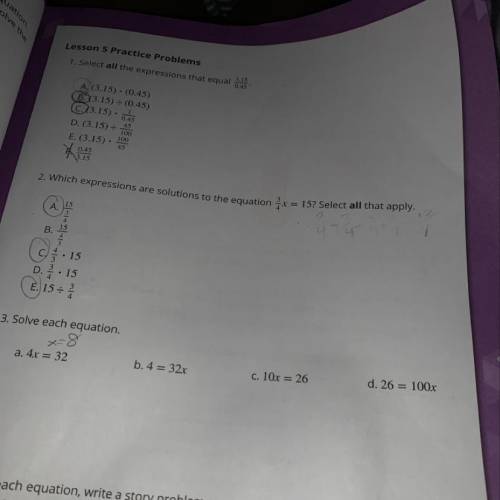
Can you guys help with #3? I already did 3a, but not sure if it’s correct
...

Mathematics, 27.02.2020 14:46 ashiteru123
Can you guys help with #3? I already did 3a, but not sure if it’s correct

Answers: 1
Another question on Mathematics
Mathematics, 21.06.2019 13:40
Use the normal approximation to the binomial distribution to answer this question. fifteen percent of all students at a large university are absent on mondays. if a random sample of 12 names is called on a monday, what is the probability that four students are absent?
Answers: 2
Mathematics, 21.06.2019 16:00
Part one: measurements 1. measure your own height and arm span (from finger-tip to finger-tip) in inches. you will likely need some from a parent, guardian, or sibling to get accurate measurements. record your measurements on the "data record" document. use the "data record" to you complete part two of this project. name relationship to student x height in inches y arm span in inches archie dad 72 72 ginelle mom 65 66 sarah sister 64 65 meleah sister 66 3/4 67 rachel sister 53 1/2 53 emily auntie 66 1/2 66 hannah myself 66 1/2 69 part two: representation of data with plots 1. using graphing software of your choice, create a scatter plot of your data. predict the line of best fit, and sketch it on your graph. part three: the line of best fit include your scatter plot and the answers to the following questions in your word processing document 1. 1. which variable did you plot on the x-axis, and which variable did you plot on the y-axis? explain why you assigned the variables in that way. 2. write the equation of the line of best fit using the slope-intercept formula $y = mx + b$. show all your work, including the points used to determine the slope and how the equation was determined. 3. what does the slope of the line represent within the context of your graph? what does the y-intercept represent? 5. use the line of best fit to you to describe the data correlation.
Answers: 2
Mathematics, 21.06.2019 18:20
Do social recommendations increase ad effectiveness? a study of online video viewers compared viewers who arrived at an advertising video for a particular brand by following a social media recommendation link to viewers who arrived at the same video by web browsing. data were collected on whether the viewer could correctly recall the brand being advertised after seeing the video. the results are given below.correctly recalled the brandarrival 409153browsing20484b. conduct the hypothesis test, using the 0.025 level of significance.what is the value of the test statistic? χ2stat=what is the p-value? p-value=is this value significant atα=0.025?
Answers: 2
Mathematics, 21.06.2019 19:30
If chord ab is congruent to chord cd, then what must be true about ef and eg?
Answers: 1
You know the right answer?
Questions
Mathematics, 27.08.2020 21:01


History, 27.08.2020 21:01
History, 27.08.2020 21:01


Physics, 27.08.2020 21:01
Mathematics, 27.08.2020 21:01

Social Studies, 27.08.2020 21:01
Engineering, 27.08.2020 21:01

Biology, 27.08.2020 21:01
Mathematics, 27.08.2020 21:01

Arts, 27.08.2020 21:01


