
Mathematics, 21.02.2020 16:20 ag1606
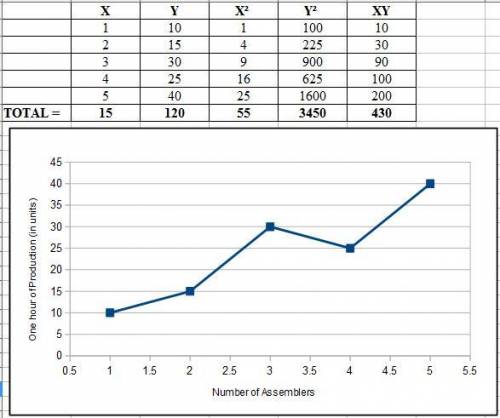
The production department of Celltronics International wants to explore the relationship between the number of employees who assemble a subassembly and the number produced. As an experiment, 2 employees were assigned to assemble the subassemblies. They produced 15 during a one-hour period. Then 4 employees assembled them. They produced 25 during a one-hour period. The complete set of paired observations follows.
Number of Assemblers One Hour of Production (units)
2 15
4 25
1 10
5 40
3 30
The dependent variable is production; that is, it is assumed that different levels of production result from a different number of employees.
(a) Draw a scatter diagram.
(b) Based on the scatter diagram, does there appear to be any relationship between the number of assemblers and production? Explain.
(c) Compute the correlation coefficient.

Answers: 2
![r=\frac{n\sum XY-\sum X\sum Y}{\sqrt{[n\sum X^{2}-(\sum X)^{2}][n\sum Y^{2}-(\sum Y)^{2}]}} }](/tpl/images/0519/1619/6eb50.png)
![r=\frac{n\sum XY-\sum X\sum Y}{\sqrt{[n\sum X^{2}-(\sum X)^{2}][n\sum Y^{2}-(\sum Y)^{2}]}} }=\frac{(5\times430)-(15\times120)}{\sqrt{[(5\times55)-15^{2}][(5\times3450)-120^{2}]}} =0.9272](/tpl/images/0519/1619/07094.png)
Another question on Mathematics
Mathematics, 21.06.2019 17:00
You are a clerk at convenience store. a customer owes 11.69 for a bag of potatoes chips. she gives you a five dollar bill. how much change should the customer receive?
Answers: 2
Mathematics, 21.06.2019 18:30
The volume of gas a balloon can hold varies directly as the cube of its radius. imagine a balloon with a radius of 3 inches can hold 81 cubic inches of gas. how many cubic inches of gas must be released to reduce the radius down to 2 inches?
Answers: 2
Mathematics, 21.06.2019 19:00
Acompany manufactures large valves, packed in boxes. a shipment consists of 1500 valves packed in 75 boxes. each box has the outer dimensions 1.2 x 0.8 x 1.6 m and the inner dimensions 1.19 x 0.79 x 1.59 m. the boxes are loaded on a vehicle (truck + trailer). the available capacity in the vehicle combination is 140 m3. each valve has a volume of 0.06 m3. - calculate the load factor on the box level (%). - calculate the load factor on the vehicle level (%). - calculate the overall load factor (%).
Answers: 1
Mathematics, 21.06.2019 19:30
The table below represents the displacement of a fish from its reef as a function of time: time (hours) x displacement from reef (feet) y 0 4 1 64 2 124 3 184 4 244 part a: what is the y-intercept of the function, and what does this tell you about the fish? (4 points) part b: calculate the average rate of change of the function represented by the table between x = 1 to x = 3 hours, and tell what the average rate represents. (4 points) part c: what would be the domain of the function if the fish continued to swim at this rate until it traveled 724 feet from the reef? (2 points)
Answers: 2
You know the right answer?
The production department of Celltronics International wants to explore the relationship between the...
Questions
Mathematics, 08.03.2021 21:30


Mathematics, 08.03.2021 21:30

Mathematics, 08.03.2021 21:30
English, 08.03.2021 21:30
Mathematics, 08.03.2021 21:30


Biology, 08.03.2021 21:30

Mathematics, 08.03.2021 21:30
Mathematics, 08.03.2021 21:30


