
![r=\frac{5(162)-(30)(25)}{\sqrt{[5(206) -(30)^2][5(155) -(25)^2]}}=0.42967](/tpl/images/0518/6210/3bd7c.png)


![r=\frac{n(\sum xy)-(\sum x)(\sum y)}{\sqrt{[n\sum x^2 -(\sum x)^2][n\sum y^2 -(\sum y)^2]}}](/tpl/images/0518/6210/ec454.png)

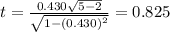
 , and then the final conclusion would be:
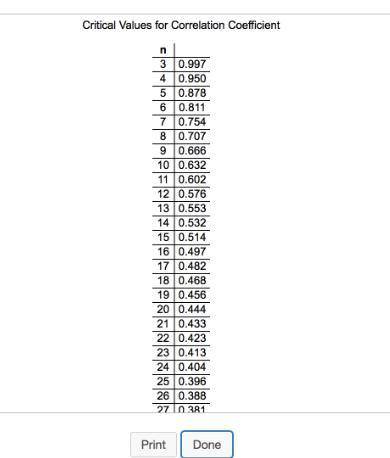
(a) For the accompanying data set, draw a scatter diagram of the data.
x 2 6 6 7 9
y 3 2...

Mathematics, 21.02.2020 02:31 evazquez
(a) For the accompanying data set, draw a scatter diagram of the data.
x 2 6 6 7 9
y 3 2 6 9 5
(b) by hand compute the correlation coefficient. r = (round to three decimals as needed.)
(c) Fill in the blanks: Because the correlation coefficient is (positive or negative) and the absolute value of the correlation coefficient, , is (greater or not greater) than the critical value for this data set,___, (no, a positive, or a negative) linear relation exists between x and y.

Answers: 3
Another question on Mathematics
Mathematics, 21.06.2019 15:00
This is the number of parts out of 100, the numerator of a fraction where the denominator is 100. submit
Answers: 3
Mathematics, 21.06.2019 17:00
The angle of a triangle are given as 6x,(x-3), and (3x+7). find x then find the measures of the angles
Answers: 3
Mathematics, 21.06.2019 17:20
Read the equations in the table below. then drag a description of the situation and a table to represent each equation. indicate whether each of the relationships is proportional or non-proportional.
Answers: 1
Mathematics, 21.06.2019 17:30
Subscriptions to a popular fashion magazine have gone down by a consistent percentage each year and can be modeled by the function y = 42,000(0.96)t. what does the value 42,000 represent in the function?
Answers: 2
You know the right answer?
Questions

Mathematics, 17.04.2020 16:18

Biology, 17.04.2020 16:18
Mathematics, 17.04.2020 16:18


English, 17.04.2020 16:18

History, 17.04.2020 16:18
Mathematics, 17.04.2020 16:18
Mathematics, 17.04.2020 16:18


