
Mathematics, 15.02.2020 01:22 Daniah2206
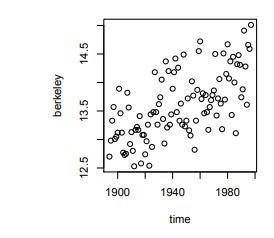
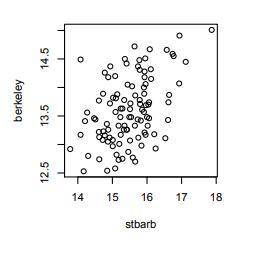
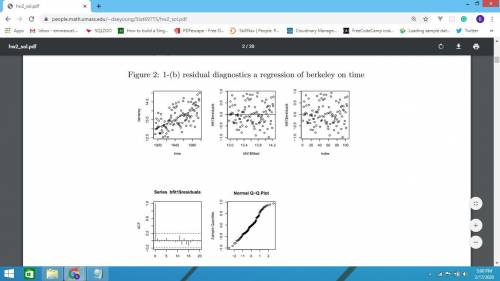
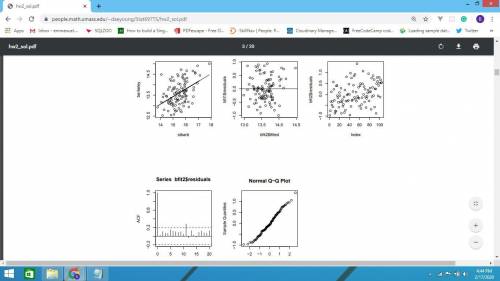
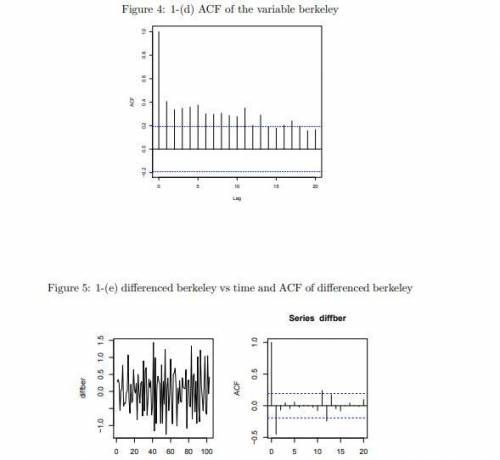
The file "berkeley. dat" contains average yearly temperatures for the cities of Berkeleyand Santa Barbara. Import the data into R using the following commandsberk<-scan("berkeley. dat", what=list(double(0),double(0),doubl e(0)))time<-berk[[1]]berkeley< ;-berk[[2]]stbarb<-berk[[3]](a) Plot the . Also, plotberkeleyversusstbarb.(b) Perform a regression ofberkeleyontime. What do you think about this fit? Besure to make diagnostic plots (including ACF) of the residuals. If there are anyviolations of the assumptions for a linear regression model, make sure to commenton them.(c) Perform a regression ofberkeleyonstbarb. Comment on the fit and the resid-uals.(d) Make a time series plot of the variableberkeleyand an ACF plot of the data. Does the time series appear to be stationary? Explain. Interpret the ACF plotin this situation.(e) Difference the data. The commanddiff(berkeley)will produce the differenceddata. Plot this differenced data, and make an ACF plot. What is your opinion ofwhether the series is stationary after differencing?(f) Now, we have detrended this series by using linear regression and with differenc-ing. The result of detrending via regression was a model that fit rather well andresiduals that had no apparent dependency. Let us assume then that the truemodel for this data isxt=β1+β2t+wt4
wherewt, t= 1, ..., Tis Gaussian white noise with varianceσ2w. (This is the sameas assuming that this data follows the standard regression assumptions.) Assum-ing this model, describe the model (i. e. write out a formula) for the differencedtime series,∇xt. Use this to explain the apparent dependency in the differenceddata from 1e above

Answers: 1

Another question on Mathematics
Mathematics, 21.06.2019 16:00
Which term best describes the association between variables a and b? no association a negative linear association a positive linear association a nonlinear association a scatterplot with an x axis labeled, variable a from zero to ten in increments of two and the y axis labeled, variable b from zero to one hundred forty in increments of twenty with fifteen points in a positive trend.
Answers: 2
Mathematics, 21.06.2019 20:30
Cody was 165cm tall on the first day of school this year, which was 10% taller than he was on the first day of school last year.
Answers: 1
Mathematics, 21.06.2019 21:20
Rose bought a new hat when she was on vacation. the following formula describes the percent sales tax rose paid b=t-c/c
Answers: 3
Mathematics, 21.06.2019 22:30
The party planning committee has to determine the number of tables needed for an upcoming event. if a square table can fit 8 people and a round table can fit 6 people, the equation 150 = 8x + 6y represents the number of each type of table needed for 150 people.
Answers: 1
You know the right answer?
The file "berkeley. dat" contains average yearly temperatures for the cities of Berkeleyand Santa Ba...
Questions
Mathematics, 09.03.2021 22:20

Physics, 09.03.2021 22:20


Health, 09.03.2021 22:20
Mathematics, 09.03.2021 22:20
Mathematics, 09.03.2021 22:20


Biology, 09.03.2021 22:20
English, 09.03.2021 22:20
Mathematics, 09.03.2021 22:20
Mathematics, 09.03.2021 22:20
Physics, 09.03.2021 22:20

Business, 09.03.2021 22:20


