
Mathematics, 14.02.2020 21:39 star3554
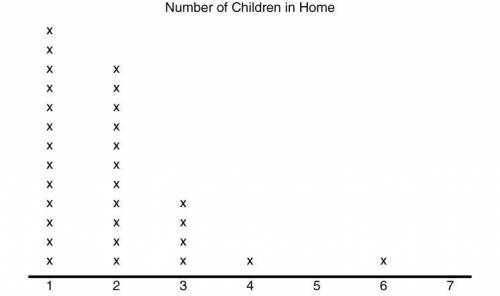
The following dot plot represents a random sample of elementary students and the number of children that live in their home.
If this random sample is representative of elementary students in the United States, which of the following inferences can be made from the data? Select all that apply.
All households in the United States contain at least one child.
Very few households in the United States contain four or more children.
None of the households in the United States contain five children.
The majority of the households in the United States, with at least one child, contain less than three children.

Answers: 3
Another question on Mathematics
Mathematics, 21.06.2019 18:00
George has seven boxes of five pencils. giulio three boxes of eight pencils. one of the boys arranges all his pencils equally into two groups. was this george or giulio how many are in each group explain
Answers: 1
Mathematics, 21.06.2019 19:00
The area of square garden is 300m squared. how long is the diagonal?
Answers: 1
Mathematics, 21.06.2019 23:40
The function f(x)= -(x+5)(x+1) is down. what is the range of the function?
Answers: 3
Mathematics, 22.06.2019 01:00
Pentagon abcde is dilated according to the rule do,3(x,y) to create the image pentagon a'b'c'd'e', which is shown on the graph. what are the coordinates of point a of the pre-image? a) (-1, 1)b) (-1, 2)c) (-9, 6)d) (-9, 18)
Answers: 3
You know the right answer?
The following dot plot represents a random sample of elementary students and the number of children...
Questions
Mathematics, 20.09.2019 11:50

Mathematics, 20.09.2019 11:50

Social Studies, 20.09.2019 11:50
Social Studies, 20.09.2019 11:50
Mathematics, 20.09.2019 11:50

History, 20.09.2019 11:50


English, 20.09.2019 11:50

Business, 20.09.2019 11:50


