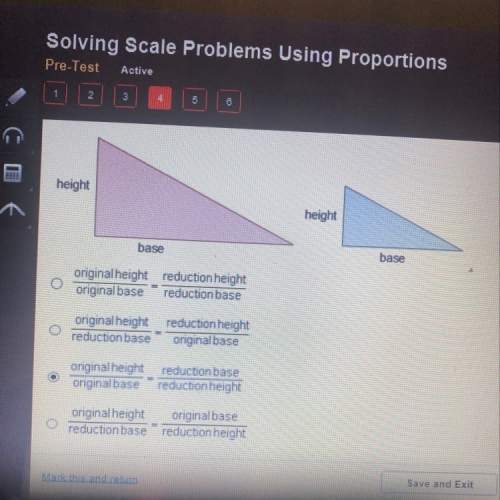
Help me Please
Suppose you are going to graph the data in the table:
Minutes Tempe...

Mathematics, 13.02.2020 21:45 nyceastcoast
Help me Please
Suppose you are going to graph the data in the table:
Minutes Temperature (°C)
1 −2
2 5
3 10
4 24
5 35
6 22
7 6
8 −8
What data should be represented on each axis, and what should the axis increments be?
x‒axis: minutes in increments of 1; y-axis: temperature in increments of 5
x‒axis: minutes in increments of 5; y-axis: temperature in increments of 1
x‒axis: temperature in increments of 5; y-axis: minutes in increments of 1
x‒axis: temperature in increments of 1; y-axis: minutes in increments of 5

Answers: 1
Another question on Mathematics
Mathematics, 21.06.2019 18:00
Write an equation in slope intercept form of the line passes through the given point and is parallel to the graph of the given equation (0,0); y=3/8 x+2
Answers: 1
You know the right answer?
Questions


Computers and Technology, 21.04.2020 22:31
Mathematics, 21.04.2020 22:31


Social Studies, 21.04.2020 22:31
Mathematics, 21.04.2020 22:31
English, 21.04.2020 22:31
History, 21.04.2020 22:31
Mathematics, 21.04.2020 22:31


