
Mathematics, 13.02.2020 05:51 kevo2024
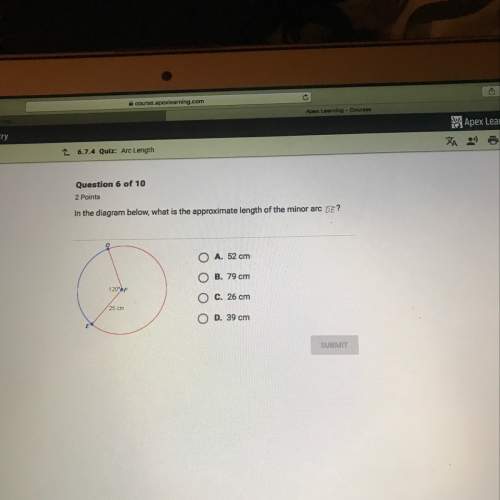
The following chart represents the record low temperatures recorded in Phoenix for April-November. Select the answer below that best describes the mean and the median of the data set (round answers to the nearest tenth). A graph titled Phoenix Low Temperatures has month on the x-axis and temperature (degrees Fahrenheit) on the y-axis. April, 32; May, 40; June, 50; July, 61; August, 60; September, 47; October, 34; November, 25. a. The mean is 43.5°F, and the median is 43.6°F. b. The mean is 60.5°F, and the median is 60.5°F. c. The mean is 60°F, and the median is 61°F. d. The mean is 43.6°F, and the median is 43.5°F.
D

Answers: 3
Another question on Mathematics
Mathematics, 21.06.2019 13:00
Sal is tiling his entryway. the floor plan is drawn on a unit grid. each unit length represents 1 foot. tile costs $1.35 per square foot. how much will sal pay to tile his entryway? round your answer to the nearest cent.
Answers: 2
Mathematics, 21.06.2019 14:00
Alicense plate is to consist of 44 digits followed by 55 uppercase letters. determine the number of different license plates possible if the first and second digits must be? odd, and repetition is not permitted.
Answers: 3
Mathematics, 21.06.2019 16:30
Consider 6x2 + 6x + 1. which term immediately tells you that this expression is not a perfect square trinomial? justify your answer
Answers: 2
Mathematics, 21.06.2019 19:00
What are the solutions of the equation? 16x^2 + 24x + 5 = 5 a. 1/4, 5/4 b. -1/4, -5/4 c. -1/4, 5/4 d. 1/4 , -5/4
Answers: 1
You know the right answer?
The following chart represents the record low temperatures recorded in Phoenix for April-November. S...
Questions
Mathematics, 10.12.2019 16:31


History, 10.12.2019 16:31
History, 10.12.2019 16:31
Mathematics, 10.12.2019 16:31
History, 10.12.2019 16:31
History, 10.12.2019 16:31
Mathematics, 10.12.2019 16:31
Mathematics, 10.12.2019 16:31

Mathematics, 10.12.2019 16:31

Mathematics, 10.12.2019 16:31
English, 10.12.2019 16:31


