
Mathematics, 11.02.2020 00:33 adamflex
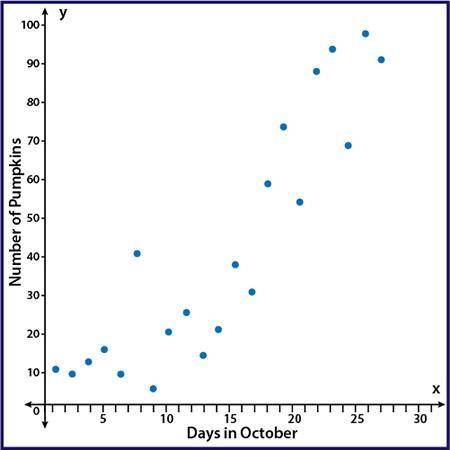
The scatter plot shows the number of pumpkins that have been picked on the farm during the month of October:
A scatter plot with points showing an upward trend with points that are moderately spread out from a line of best fit. The y axis is labeled Number of Pumpkins and the x axis is labeled Days in October
Part A: Using computer software, a correlation coefficient of r = 0.51 was calculated. Based on the scatter plot, is that an accurate value for this data? Why or why not? (5 points)
Part B: Instead of comparing the number of pumpkins picked and the day in October, write a scenario that would be a causal relationship for pumpkins picked on the farm. (5 points

Answers: 3
Another question on Mathematics
Mathematics, 21.06.2019 12:50
Write a polynomial function f of least degree that has rational coefficients, a leading coefficient of 1, and the given zeros. 1, 2−√3
Answers: 2
Mathematics, 21.06.2019 16:30
Problem fathi wants to print out a pdf document that is 48 pages long. to save paper, he decides to print on both sides of each sheet and to print two pages on each side of the sheet. how many sheets of paper will he need?
Answers: 3
Mathematics, 21.06.2019 19:40
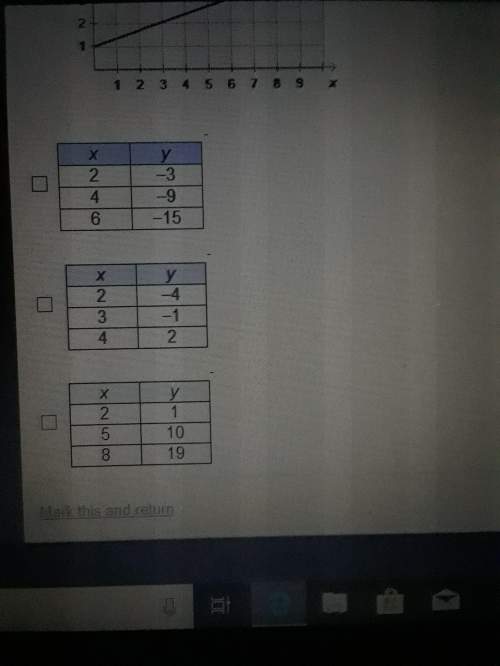
Ascatter plot with a trend line is shown below. which equation best represents the given data? y = x + 2 y = x + 5 y = 2x + 5
Answers: 1
You know the right answer?
The scatter plot shows the number of pumpkins that have been picked on the farm during the month of...
Questions

Social Studies, 20.11.2020 21:00

Mathematics, 20.11.2020 21:00
Social Studies, 20.11.2020 21:00

Chemistry, 20.11.2020 21:00

Chemistry, 20.11.2020 21:00

English, 20.11.2020 21:00
Mathematics, 20.11.2020 21:00
Chemistry, 20.11.2020 21:00

Mathematics, 20.11.2020 21:00
Mathematics, 20.11.2020 21:00
Mathematics, 20.11.2020 21:00
Chemistry, 20.11.2020 21:00


