
Mathematics, 24.01.2020 07:31 mandy9386
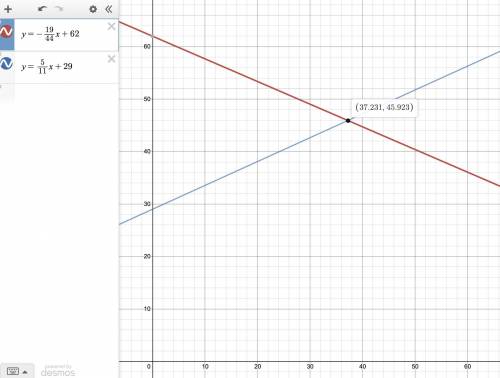
The share of aggregate income held by middle-income households in 1970 was 62%, whereas that held by upper-income households was 29%. the corresponding figures in 2014 were 43% and 49%, respectively. the models describing the fall and the rise in the share of the aggregate incomes of these two groups are approximately linear over the period under consideration.† (a) find the mathematical models describing the percent share of aggregate income held by each group from 1970 through 2014. (let t denote the time, in years, with t = 0 corresponding to the beginning of 1970.) middle-income households y = incorrect: your answer is incorrect. upper-income households y = incorrect: your answer is incorrect. (b) find the time when the aggregate income held by upper-income households first exceeded that held by middle-income households. (give the calendar year in which the change occurred.)

Answers: 1
Another question on Mathematics
Mathematics, 21.06.2019 13:00
(98 points) i need with 5 questions. answer definitions are welcomed, but not necessary.
Answers: 3
Mathematics, 21.06.2019 20:30
Martha has a deck of cards. she has lost some of the cards, and now the deck only contains nine spades, eleven diamonds, eight clubs, and twelve hearts. martha predicts that whenever she draws a card from the deck without looking, she will draw a club one-fifth of the time. which activity would best allow martha to test her prediction? a. randomly draw a card from the box and see if it is a club. b. randomly draw a card. then, continue to draw another card until all eight clubs are drawn. c. randomly draw and replace a card 120 times. then, observe how close to 30 times a club is drawn. d. randomly draw and replace a card 100 times. then, observe how close to 20 times a club is drawn.
Answers: 1
Mathematics, 22.06.2019 01:30
Apply distributive property to write equivalent equation 105×35m
Answers: 1
Mathematics, 22.06.2019 01:50
:i need some real : a store sells shirts to the public at one pricing scale and wholesale at another pricing scale. the tables below describe the cost, y, of x shirts. (after tables) how do the slopes of the lines created by each table compare? the slope of the public table is 3/4 of the slope of the wholesale table.the slope of the wholesale table is 3/4 of the slope of the public table.the slope of the public table is 12 times greater than the slope of the wholesale table.the slope of the wholesale table is 12 times greater than the slope of the public table.
Answers: 3
You know the right answer?
The share of aggregate income held by middle-income households in 1970 was 62%, whereas that held by...
Questions


Social Studies, 02.01.2020 22:31


Mathematics, 02.01.2020 22:31

Social Studies, 02.01.2020 22:31

Computers and Technology, 02.01.2020 22:31


