
Mathematics, 24.01.2020 02:31 viktoria1198zz
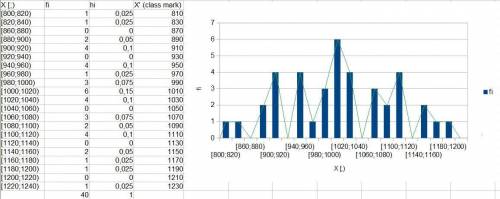
Construct a frequency distribution and a relative frequency distribution for the light bulb data with a class width of 20, starting at 800. copy and paste your distribution tables here. 2. construct a histogram based on this frequency distribution table for the light bulb data. copy and paste your histogram here. describe the shape of the histogram. (is it unimodal, bimodal, skewed, skewed 3. now, construct a frequency distribution table and a relative frequency distribution table for the light bulb data with a class width of 100, starting at 800. copy and paste your distribution tables here. 5. construct a histogram based on this frequency distribution table for the data. copy and paste your histogram here. describe the shape of the histogram. (is it unimodal, bimodal, skewed,
819
836
888
897
903
907
912
918
942
943
952
959
962
986
992
994
1004
1005
1007
1015
1016
1018
1020
1022
1034
1038
1072
1077
1077
1082
1096
1100
1113
1113
1116
1153
1154
1174
1188
1230

Answers: 1
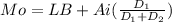

![Me= LB + Ai*[\frac{PosMe - F_{i-1}}{f_i} ]](/tpl/images/0468/2224/26eaf.png)
![Me= 1000+ 20*[\frac{20-16}{6} ]= 1013.33](/tpl/images/0468/2224/23181.png)
![X[bar]= \frac{sum x'*fi}{n}](/tpl/images/0468/2224/ba889.png)
![X[bar]= \frac{40700}{40} = 1017.5](/tpl/images/0468/2224/fd7a3.png)

![Me= 1000+ 100*[\frac{20-16}{15} ]= 1026.67](/tpl/images/0468/2224/24b28.png)
![X[bar]= \frac{41000}{40} = 1025](/tpl/images/0468/2224/9448f.png)
Another question on Mathematics
Mathematics, 21.06.2019 17:30
Find the zero function by factoring (try to show work) h(x)=-x^2-6x-9
Answers: 2
Mathematics, 21.06.2019 18:00
What is the solution to the equation in the & show work i’m very
Answers: 1
Mathematics, 21.06.2019 20:30
Carley bought a jacket that was discounted 10% off the original price. the expression below represents the discounted price in dollars, based on x, the original price of the jacket.
Answers: 1
Mathematics, 21.06.2019 20:50
An object is translated by (x + 4, y - 2). if one point in the image has the coordinates (5, -3), what would be the coordinates of its pre-image? (9, -5) (1, -5) (9, -1) (1, -1)
Answers: 1
You know the right answer?
Construct a frequency distribution and a relative frequency distribution for the light bulb data wit...
Questions


History, 16.07.2019 21:30
History, 16.07.2019 21:30

Mathematics, 16.07.2019 21:30
Social Studies, 16.07.2019 21:30

Chemistry, 16.07.2019 21:30
Biology, 16.07.2019 21:30
History, 16.07.2019 21:30
Social Studies, 16.07.2019 21:30
Mathematics, 16.07.2019 21:30
History, 16.07.2019 21:30
Mathematics, 16.07.2019 21:30

English, 16.07.2019 21:30


