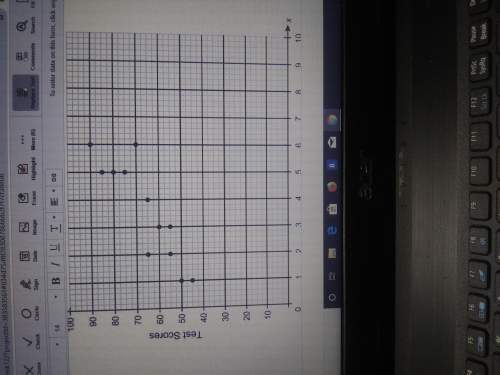
Consider this scatter plot.
(a) how would you characterize the relationship between the...

Mathematics, 18.01.2020 02:31 Woodlandgirl14
Consider this scatter plot.
(a) how would you characterize the relationship between the hours spent on homework and the test
scores? explain.
(b) paul uses the function y = 8x + 42 to model the situation. what score does the model predict for 3 h
of homework?

Answers: 3
Another question on Mathematics
Mathematics, 21.06.2019 18:30
Select 2 statements that are true about the equation y+6=-10(x-3).1) the slope of the line is -102) the slope of the line is 33) one point on the line is (3,6)4) one point on the line is (3,-6)
Answers: 1
Mathematics, 21.06.2019 19:00
Find the y-intercept and x-intercept for the equation 5x-3y=60 what is the y-intercept
Answers: 1
Mathematics, 22.06.2019 02:00
The table below shows the approximate masses of a dust particle and a grain of pollen. dust particle 0.000000778 g grain of pollen 0.00000000155 g the mass of a dust particle can be estimated and written in the form a × 10^b, where a = 8 and b = the mass of a grain of pollen can be estimated and written in the form a × 10^b, where a = 2 and b = based on the estimates, the mass of a dust particle is approximately blank times larger than the mass of a grain of pollen.
Answers: 1
You know the right answer?
Questions

Mathematics, 24.02.2021 21:20

Mathematics, 24.02.2021 21:20

Biology, 24.02.2021 21:20

Chemistry, 24.02.2021 21:20
Mathematics, 24.02.2021 21:20
Mathematics, 24.02.2021 21:20

History, 24.02.2021 21:20
Mathematics, 24.02.2021 21:20


