geometric series converge the common ratio r has magnitude less than one.

which is equivalent to

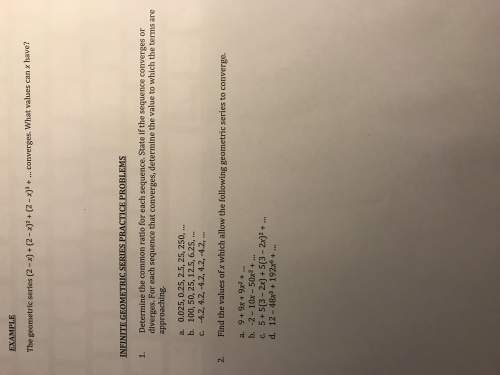
for the example we need
|2-x| < 1
-1 < 2-x and 2-x < 1
x < 3 and x > 1
we can write that
answer: 1 < x < 3
1a. common ratio r=250/25=10 > 1 diverges
1b. r=50/100=1/2 converges
when these converge they converge to

where a is the first term.

answer: 200
1c. r=-1 so it's not the case that |r| < 1. diverges
2a. x is the common ratio so we converge when |x|< 1
2b. r=-10x / -2 = 5x.
we converge when
|5x| < 1
|x| < 1/5
2c. r=3-2x
-1 < 3-2x and 3-2x < 1
-4 < -2x and 2 < 2x
x < 2 and 1 < x
1 < x < 2
2d. [/tex] r=-48x^3/12 = 4x^3[/tex]
|4x^3| < 1
|x^3| < \frac 1 4
|x| < 4^{-1/3}
![|x| < \frac 1 2 \sqrt[3]{2}](/tex.php?f= |x| < \frac 1 2 \sqrt[3]{2})

![Which inequality is represented by this graph? a. [tex]x > - 53[/tex]](/tpl/images/00/09/vbzv4SyTEJZos8v1.jpg)


