
Mathematics, 10.12.2019 02:31 bks53
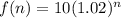
Ascientist is studying the growth of a particular species of plant. he writes the following equation to show the height of the plant f(n), in cm, after n days:
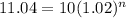
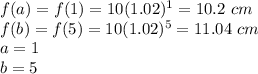
f(n) = 10(1.02)n
part a: when the scientist concluded his study, the height of the plant was approximately 11.04 cm. what is a reasonable domain to plot the growth function?
part b: what does the y-intercept of the graph of the function f(n) represent?
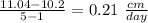
part c: what is the average rate of change of the function f(n) from n = 1 to n = 5, and what does it represent?

Answers: 2


 ----> initial value or y-intercept (value of he function when the value of n is equal to zero)
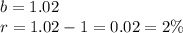
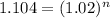
![log(1.104)=n[log(1.02)]](/tpl/images/0411/0016/89a19.png)


Another question on Mathematics
Mathematics, 21.06.2019 15:10
5.(04.07) two different plants grow each year at different rates, which are represented by the functions f(x) = 4* and g(x) = 5x + 2. what is the first year the f(x) height is greater than the g(x) height? year 3 year 0 year 2 year 1
Answers: 1
Mathematics, 21.06.2019 20:00
Axel follows these steps to divide 40 by 9: start with 40. 1. divide by 9 and write down the remainder. 2. write a zero after the remainder. 3. repeat steps 1 and 2 until you have a remainder of zero. examine his work, and then complete the statements below.
Answers: 1
Mathematics, 21.06.2019 21:00
Suppose a gym membership has an initial enrollment fee of $75 and then a fee of $29 a month. which equation models the cost, c, of the gym membership for m months?
Answers: 1
You know the right answer?
Ascientist is studying the growth of a particular species of plant. he writes the following equation...
Questions


Mathematics, 12.12.2019 00:31

English, 12.12.2019 00:31
Mathematics, 12.12.2019 00:31

Mathematics, 12.12.2019 00:31

Mathematics, 12.12.2019 00:31

Mathematics, 12.12.2019 00:31
Mathematics, 12.12.2019 00:31
Mathematics, 12.12.2019 00:31


