Hi , !
mrs. goodman’s physics class built different-shaped parachutes to see which shapes w...

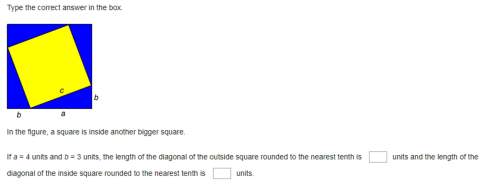
Mathematics, 05.12.2019 04:31 Meirna
Hi , !
mrs. goodman’s physics class built different-shaped parachutes to see which shapes were more effective. the students tested the parachutes by dropping them from a height of 20 feet and timing the fall. they calculated the summary below:
mean: 4.6 seconds
standard deviation: 0.4 seconds
min: 2.3 seconds
q1: 3.1 seconds
median: 4.2 seconds
q3: 5.5 seconds
max: 6.4 seconds
the students want to see what happens to their times when they drop the parachutes from 32 feet. they find that the time of every drop is increased by 2 seconds. find the new mean and standard deviation.
a.) mean, 6.6 seconds, standard deviation; 0.4 second
b.) mean, 2.6 seconds, standard deviation; 0.4 second
c.) mean, 6.6 seconds, standard deviation; 2.4 seconds
d.) mean,4.6 seconds; standard deviation, 2.4 seconds

Answers: 2
Another question on Mathematics
Mathematics, 21.06.2019 22:30
5. (04.07)which of the following exponential functions goes through the points (1, 12) and (2, 36)? (2 points)f(x) = 3(4)^xf(x) = 4(3)^-xf(x) = 3(4)^-xf(x) = 4(3)^x
Answers: 1
Mathematics, 22.06.2019 02:00
1. the manager of collins import autos believes the number of cars sold in a day (q) depends on two factors: (1) the number of hours the dealership is open (h) and (2) the number of salespersons working that day (s). after collecting data for two months (53 days), the manager estimates the following log-linear model: q 4 equation 1 a. explain, how to transform the log-linear model into linear form that can be estimated using multiple regression analysis. the computer output for the multiple regression analysis is shown below: q4 table b. how do you interpret coefficients b and c? if the dealership increases the number of salespersons by 20%, what will be the percentage increase in daily sales? c. test the overall model for statistical significance at the 5% significance level. d. what percent of the total variation in daily auto sales is explained by this equation? what could you suggest to increase this percentage? e. test the intercept for statistical significance at the 5% level of significance. if h and s both equal 0, are sales expected to be 0? explain why or why not? f. test the estimated coefficient b for statistical significance. if the dealership decreases its hours of operation by 10%, what is the expected impact on daily sales?
Answers: 2
Mathematics, 22.06.2019 03:00
In the figure, triangle aob and triangle boc form a linear pair ,find the measure of x
Answers: 3
You know the right answer?
Questions

English, 13.05.2021 14:00


Mathematics, 13.05.2021 14:00

Geography, 13.05.2021 14:00

Computers and Technology, 13.05.2021 14:00

Mathematics, 13.05.2021 14:00

World Languages, 13.05.2021 14:00
Computers and Technology, 13.05.2021 14:00

Medicine, 13.05.2021 14:00
Mathematics, 13.05.2021 14:00


