Which association best describes the data in the table?
variable x: 12 18 16 8 9 5 10 14 11...

Mathematics, 24.08.2019 05:00 jjimenez0276
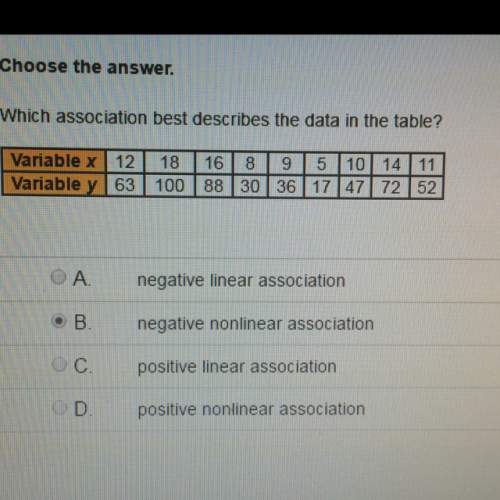
Which association best describes the data in the table?
variable x: 12 18 16 8 9 5 10 14 11
variable y: 63 100 88 30 36 17 47 72 52
a. negative linear association
b. negative non linear association
c. positive linear association
d. positive non linear association
i think it could be b..not sure though. !

Answers: 1
Another question on Mathematics
Mathematics, 21.06.2019 18:10
What is the equation in slope-intercept form of the linear function represented by the table? y -18 -1 -8 4 2 912 o y=-2x-6 o y=-2x+6 o y=2x-6 o y = 2x+6
Answers: 1
Mathematics, 22.06.2019 02:30
Solve for x -3+3b> 9a: ) x> 4b-9/3b: ) x< 9-4b/3c: ) x< -4b+9/-3d: ) x> 4b+9/-3
Answers: 1
Mathematics, 22.06.2019 02:50
The graph of f(x) shown below has the same shape as the graph of g(x)=x^3-x^2 but it is shifted to the left 2 units what is its equation
Answers: 2
You know the right answer?
Questions


Computers and Technology, 13.10.2020 21:01


English, 13.10.2020 21:01

Engineering, 13.10.2020 21:01
Mathematics, 13.10.2020 21:01


Spanish, 13.10.2020 21:01
Mathematics, 13.10.2020 21:01
Business, 13.10.2020 21:01

English, 13.10.2020 21:01


Advanced Placement (AP), 13.10.2020 21:01


