
Mathematics, 29.11.2019 00:31 LindaCat78
Country financials, a financial services company, uses surveys of adults age 18 and older to determine if personal financial fitness is changing over time. in february 2012, a sample of 1000 adults showed 410 indicating that their financial security was more that fair. in feb 2010, a sample of 900 adults showed 315 indicating that their financial security wwas more than fair.
1.state the hypothesis that can be used to test for a significant difference between the population proportions for the two years?
2.what is the sample proportion indicating that theirfinancial security was more that fair in 2012? in 2010?
3.conduct the hypothesis test and compute the p-value. at a .05 level of significance what is your conclusion?
4.what is the 95% confidence interval estimate of the difference between the two population proportion?

Answers: 1


 always
  so we can conclude that we have enough evidence to reject the null hypothesis, and we can say the the proportion of people sampled in 2012 is significantly different than the porportion samples in 2010.
  represent the number of people in 2012 indicating that their financial security was more that fair
 represent the number of people in 2010 indicating that their financial security was more that fair
 sample in 2012 selected
 sample in 2010 selected
 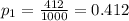 represent the proportion of people in 2012 indicating that their financial security was more that fair
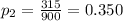 represent the proportion of people in 2010 indicating that their financial security was more that fair
 represent the value for the test (variable of interest)
 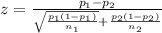 (1)
(1) 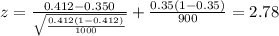
 , but we can calculate the p value for this test.
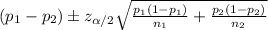


Another question on Mathematics
Mathematics, 21.06.2019 17:30
If i have one apple and give you the apple, how many apples do i have?
Answers: 2
Mathematics, 21.06.2019 19:30
Your food costs are $5,500. your total food sales are $11,000. what percent of your food sales do the food costs represent?
Answers: 2
Mathematics, 21.06.2019 22:20
The school track has eight lanes. each lane is 1.25 meters wide. the arc at each end of the track is 180. the distance of the home straight and the radii for the arcs in the 1st 4 lanes are given. s=85m r1=36.5m r2=37.75m r3=39m r4=40.25m part one: find the radii of lanes 5 through 8 of the track. show your work. part two: if max ran around lane one, how far did he run? show your work and explain your solution. part three: max wants to run a total of three laps around the track, choose two additional lanes (2-8) for him to run and find the distance around those two lanes. show your work and round to the hundredths. part 4: based on your lane choices in part three, what was the total distance max ran in the three laps around the track?
Answers: 2
Mathematics, 22.06.2019 02:30
Six random samples were taken each year for three years. the table shows the inferred population for each type of fish for each year.
Answers: 1
You know the right answer?
Country financials, a financial services company, uses surveys of adults age 18 and older to determi...
Questions


English, 06.03.2021 19:20


Geography, 06.03.2021 19:20


English, 06.03.2021 19:20

Arts, 06.03.2021 19:20

Biology, 06.03.2021 19:20
Mathematics, 06.03.2021 19:20

Social Studies, 06.03.2021 19:20
Mathematics, 06.03.2021 19:20
Biology, 06.03.2021 19:20

Chemistry, 06.03.2021 19:20


