The following data represent the length of life in
years, measured to the nearest tenth, of 3...

Mathematics, 07.11.2019 04:31 miahbaby2003p2af1b
The following data represent the length of life in
years, measured to the nearest tenth, of 30 similar fuel
pumps:
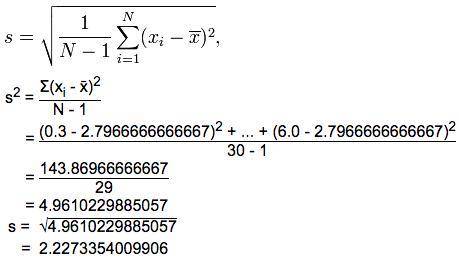
2.0 3.0 0.3 3.3 1.3 0.4
0.2 6.0 5.5 6.5 0.2 2.3
1.5 4.0 5.9 1.8 4.7 0.7
4.5 0.3 1.5 0.5 2.5 5.0
1.0 6.0 5.6 6.0 1.2 0.2
(a) construct a stem-and-leaf plot for the life in years
of the fuel pumps, using the digit to the left of the
decimal point as the stem for each observation.
(b) set up a relative frequency distribution.
(c) compute the sample mean, sample range, and sample
standard deviation.

Answers: 3
Another question on Mathematics
Mathematics, 21.06.2019 20:00
Which statement about the annual percentage rate (apr) is not true?
Answers: 3
Mathematics, 21.06.2019 20:00
Aball is dropped from a height of 10m above the ground. it bounce to 90% of its previous height on each bounce. what is the approximate height that the ball bounce to the fourth bounce?
Answers: 2
Mathematics, 21.06.2019 21:00
Calculate the missing value. round the answer to on decimal place. start with 70, increase it by 21%, and end up with
Answers: 2
You know the right answer?
Questions
Mathematics, 08.11.2019 02:31
Mathematics, 08.11.2019 02:31
Mathematics, 08.11.2019 02:31

Mathematics, 08.11.2019 02:31
Mathematics, 08.11.2019 02:31
Mathematics, 08.11.2019 02:31

History, 08.11.2019 02:31

English, 08.11.2019 02:31

Geography, 08.11.2019 02:31
Mathematics, 08.11.2019 02:31
Mathematics, 08.11.2019 02:31
Mathematics, 08.11.2019 02:31


