
Mathematics, 05.11.2019 23:31 byrdkellykellybyrd
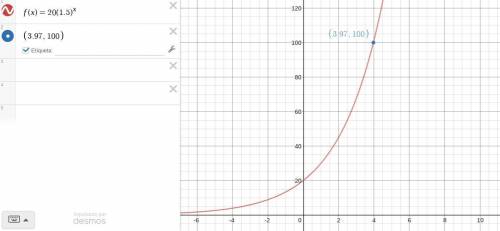
As we continue to think about modeling with mathematics, there are some situations where we do more than just model a set of data or a graph with a function. sometimes we use an existing model in a context to create a different model that relates the variables in a different way. this gives us different things to solve for and a unique way to represent the situation with graphs. the list gives some scenarios we can use exponential functions to model. study each scenario and the function that models it, then answer the questions that follow: david estimated he had about 20 fish in his pond. a year later, there were about 1.5 times as many fish. the year after that, the number of fish increased by a factor of 1.5 again. the number of fish is modeled by f(x) = 20(1.5)x. the price of gas, which started at $2.56 per gallon, increased at a rate of 4% per year. the price of gas is modeled by f(x) = 2.56(1.04)x. the chess club started with a membership of only 4 students, but the membership grew at a rate of 2.56% each week. the number of students is modeled by f(x) = 4(1.0256)x. a forest started with 256 maple trees, and the number of maple trees increased at a rate of 40% each year. the number of trees is modeled by f(x) = 256(1.4)x. in 2001, a plot of land was worth $12,000. each year, the value of the plot increases by 8%. the value of the plot is modeled by f(x) = 12,000(1.08)x. liam buys a motorcycle for $2,900. its value depreciates annually at a rate of 12%. its value is modeled as p(x) = 2,900(0.88)x. a nonnative fern species is introduced into an area and quickly begins to die. the number of plants is modeled by p(n) = 1,200(0.8)n. a radioactive substance with a mass of 64 grams decays at a rate of 25% every hour. the mass of the substance is modeled by m(x) = 64(0.75)x.
part a
choose one of the scenarios from the list, and create a question you could ask that could be answered only by graphing or using a logarithm.
part b
using logarithms to find the answer to the question in part a.
part c
let your dependent variable in the function be y. write the function that models the independent variable in terms of y, using logarithms.
part d
plot the graph of the logarithmic function you wrote in part c.
part e
we know that logarithmic functions are a bit more unusual than functions we’ve seen in the past, such as linear, exponential, quadratic, and even polynomial and radical functions. we rarely see them in examples, so what’s their real purpose as functions?

Answers: 3
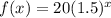
 and solve for the variable x
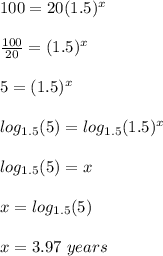
Another question on Mathematics
Mathematics, 21.06.2019 20:00
What is the radical expression that is equivalent to the expression 27 1 over 5?
Answers: 3
Mathematics, 21.06.2019 20:30
Answer asap ill give ! ’ a sample of radioactive material decays over time. the number of grams, y , of the material remaining x days after the sample is discovered is given by the equation y = 10(0.5)^x. what does the number 10 represents in the equation? a. the half-life of the radioactive material, in days b. the amount of the sample, in grams, that decays each day c. the time, in days, it will take for the samples to decay completely d. the size of the sample, in grams, at the time the material was discovered
Answers: 1
Mathematics, 21.06.2019 23:30
Find the measure of angle y. round your answer to the nearest hundredth. ( type the numerical answer only) a right triangle is shown with one leg measuring 5 and another leg measuring 14. an angle across from the leg measuring 5 is marked y degrees. numerical answers expected!
Answers: 1
You know the right answer?
As we continue to think about modeling with mathematics, there are some situations where we do more...
Questions

Mathematics, 14.07.2020 21:01

Biology, 14.07.2020 21:01
Mathematics, 14.07.2020 21:01


Mathematics, 14.07.2020 21:01

Computers and Technology, 14.07.2020 21:01

Mathematics, 14.07.2020 21:01
Mathematics, 14.07.2020 21:01
Mathematics, 14.07.2020 21:01


