
Mathematics, 04.11.2019 08:31 augestfaith
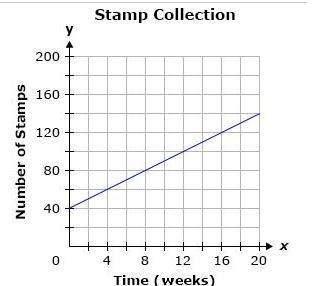
Gary has a collection of stamps. he tracks the number of stamps he collects every week. if x represents the number of weeks since he starts tracking and y represents the total number of stamps in his collection, which of the following situations is represented by the graph below?
a. gary initially has 40 stamps. he collects 20 stamps every week.
b. gary initially has 40 stamps. he collects 15 stamps every week.
c. gary initially has 40 stamps. he collects 5 stamps every week.
d. gary initially has 40 stamps. he collects 60 stamps every week.

Answers: 1
Another question on Mathematics
Mathematics, 21.06.2019 14:00
Demonstrate the proof of your new polynomial identity through an algebraic proof and a numerical proof in an engaging way! make it so the whole world wants to purchase your polynomial identity and can't imagine living without it! you must: label and display your new polynomial identity prove that it is true through an algebraic proof, identifying each step demonstrate that your polynomial identity works on numerical relationships create your own using the columns below. see what happens when different binomials or trinomials are combined. square one factor from column a and add it to one factor from column b to develop your own identity. column a column b (x − y) (x2 + 2xy + y2) (x + y) (x2 − 2xy + y2) (y + x) (ax + b) (y − x) (cy + d)
Answers: 3
Mathematics, 21.06.2019 17:30
Kathy spent 5/8 of her money on books and another 1/6 of her money on stationeries.what fraction of kathy’s money was left?
Answers: 2
Mathematics, 21.06.2019 23:30
The number of members f(x) in a local swimming club increased by 30% every year over a period of x years. the function below shows the relationship between f(x) and x: f(x) = 10(1.3)xwhich of the following graphs best represents the function? graph of f of x equals 1.3 multiplied by 10 to the power of x graph of exponential function going up from left to right in quadrant 1 through the point 0, 0 and continuing towards infinity graph of f of x equals 10 multiplied by 1.3 to the power of x graph of f of x equals 1.3 to the power of x
Answers: 1
Mathematics, 22.06.2019 00:40
Calculate the effective quarterly compound interest rate equivalent to a 1% of monthly compound interest rate.
Answers: 3
You know the right answer?
Gary has a collection of stamps. he tracks the number of stamps he collects every week. if x represe...
Questions


Biology, 20.09.2019 14:50

English, 20.09.2019 14:50

History, 20.09.2019 14:50
Health, 20.09.2019 14:50

World Languages, 20.09.2019 14:50
Mathematics, 20.09.2019 14:50
Mathematics, 20.09.2019 14:50
History, 20.09.2019 14:50

Chemistry, 20.09.2019 14:50


