
Mathematics, 01.11.2019 16:31 JaleahOwens13
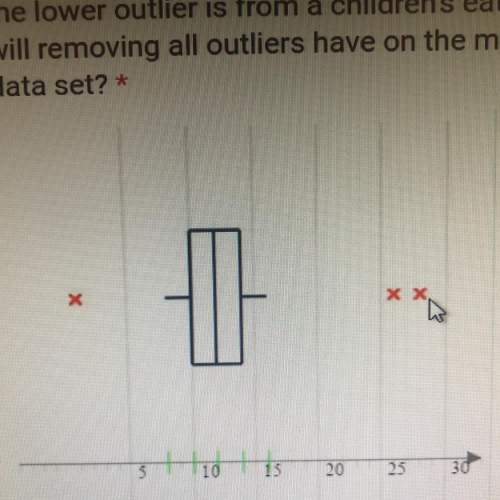
The boxplot below displays the average number of hot dogs consumed in eating contest across a particular state. the higher outliers are from professional, heavyweight contests, and the lower outlier is from a children’s eating contest. what effect will removing all outliers have on the mean and median of the data set?
a. neither the mean nor the median will change.
b. the median will change and the mean will increase
c. the median will change and the mean will decrease
d. the mean will remain unchanged and the median will increase.
e. the mean will remain unchanged and the median will decrease.

Answers: 3
Another question on Mathematics
Mathematics, 21.06.2019 15:00
Alake near the arctic circle is covered by a 222-meter-thick sheet of ice during the cold winter months. when spring arrives, the warm air gradually melts the ice, causing its thickness to decrease at a constant rate. after 333 weeks, the sheet is only 1.251.251, point, 25 meters thick. let s(t)s(t)s, left parenthesis, t, right parenthesis denote the ice sheet's thickness sss (measured in meters) as a function of time ttt (measured in weeks).
Answers: 1
Mathematics, 21.06.2019 17:00
Aquantity with an initial value of 3900 decays exponentially at a rate of 35% every hour. what is the value of the quantity after 0.5 days, to the nearest hundredth?
Answers: 1
Mathematics, 21.06.2019 23:00
Each of the following data sets has a mean of x = 10. (i) 8 9 10 11 12 (ii) 7 9 10 11 13 (iii) 7 8 10 12 13 (a) without doing any computations, order the data sets according to increasing value of standard deviations. (i), (iii), (ii) (ii), (i), (iii) (iii), (i), (ii) (iii), (ii), (i) (i), (ii), (iii) (ii), (iii), (i) (b) why do you expect the difference in standard deviations between data sets (i) and (ii) to be greater than the difference in standard deviations between data sets (ii) and (iii)? hint: consider how much the data in the respective sets differ from the mean. the data change between data sets (i) and (ii) increased the squared difference îł(x - x)2 by more than data sets (ii) and (iii). the data change between data sets (ii) and (iii) increased the squared difference îł(x - x)2 by more than data sets (i) and (ii). the data change between data sets (i) and (ii) decreased the squared difference îł(x - x)2 by more than data sets (ii) and (iii). none of the above
Answers: 2
Mathematics, 22.06.2019 01:00
On friday, there were x students at the baseball game. on monday, there were half as many students at the game as there were on friday. on wednesday, there were 32 fewer students at the game as there were on friday. which expression could represent the total number of tickets sold for all 3 games?
Answers: 2
You know the right answer?
The boxplot below displays the average number of hot dogs consumed in eating contest across a partic...
Questions
Mathematics, 17.01.2020 23:31


English, 17.01.2020 23:31

Chemistry, 17.01.2020 23:31

History, 17.01.2020 23:31

History, 17.01.2020 23:31
History, 17.01.2020 23:31

Social Studies, 17.01.2020 23:31
Mathematics, 17.01.2020 23:31
Physics, 17.01.2020 23:31

Mathematics, 17.01.2020 23:31


