
Mathematics, 25.10.2019 20:43 moisealafleur
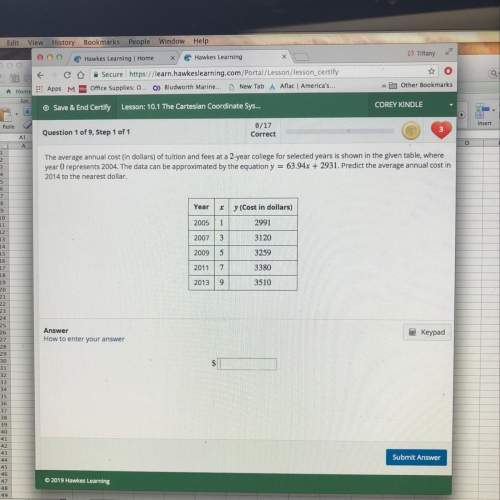
The average cost in dollars of tuition and fees at a 2 year college for selected years is shown in the given table, where 0 represents 2004.the data can be approximated by the equation y= 63.94x+293.1 predict the average annual cost in 2014 to the nearest dollar

Answers: 3

Another question on Mathematics
Mathematics, 21.06.2019 22:20
The coordinates of vortex a’ are (8,4) (-4,2) (4,-,4) the coordinates of vortex b’ are (6,6)(12,-,12)(12,12) the coordinates of vortex c’ are(-2,,12)(4,12)(12,-4)
Answers: 3
Mathematics, 21.06.2019 22:30
Acampus club held a bake sale as a fund raiser, selling coffee, muffins, and bacon and eggs sandwiches. the club members charged $1 for a cup of coffee, 3$ for a muffin , and $4 for a back. and egg sandwich. they sold a total of 55 items , easing $119. of the club members sold 5 more muffins than cups of coffee, how many bacon and egg sandwiches he’s did they sell
Answers: 1
Mathematics, 22.06.2019 00:30
Will mark brainliest for correct answer! i have been on this problem for an hour and can't find the answer. i'm begging here! incase you cant read the instructions in the picture because of too much or too little lighting: note: enter your answer and show all the steps that you use to solve this problem in the space provided.write a list of steps that are needed to find the measure of b. provide all steps as clear as possible, !
Answers: 1
Mathematics, 22.06.2019 02:30
Atrain traveled for 1.5 hours to the first station, stopped for 30 minutes, then traveled for 4 hours to the final station where it stopped for 1 hour. the total distance traveled is a function of time. which graph most accurately represents this scenario? a graph is shown with the x-axis labeled time (in hours) and the y-axis labeled total distance (in miles). the line begins at the origin and moves upward for 1.5 hours. the line then continues upward at a slow rate until 2 hours. from 2 to 6 hours, the line continues quickly upward. from 6 to 7 hours, it moves downward until it touches the x-axis a graph is shown with the axis labeled time (in hours) and the y axis labeled total distance (in miles). a line is shown beginning at the origin. the line moves upward until 1.5 hours, then is a horizontal line until 2 hours. the line moves quickly upward again until 6 hours, and then is horizontal until 7 hours a graph is shown with the axis labeled time (in hours) and the y-axis labeled total distance (in miles). the line begins at the y-axis where y equals 125. it is horizontal until 1.5 hours, then moves downward until 2 hours where it touches the x-axis. the line moves upward until 6 hours and then moves downward until 7 hours where it touches the x-axis a graph is shown with the axis labeled time (in hours) and the y-axis labeled total distance (in miles). the line begins at y equals 125 and is horizontal for 1.5 hours. the line moves downward until 2 hours, then back up until 5.5 hours. the line is horizontal from 5.5 to 7 hours
Answers: 1
You know the right answer?
The average cost in dollars of tuition and fees at a 2 year college for selected years is shown in t...
Questions


Mathematics, 05.02.2021 22:20

Arts, 05.02.2021 22:20

Mathematics, 05.02.2021 22:20

Mathematics, 05.02.2021 22:20

Biology, 05.02.2021 22:20
History, 05.02.2021 22:20
Mathematics, 05.02.2021 22:20
Chemistry, 05.02.2021 22:20


