
Mathematics, 11.10.2019 00:30 vannia
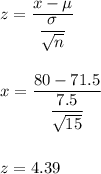
The average weight of a male labrador retriever is believed to be well-approximated by a normal distribution with mean 71.5 lbs and standard deviation 7.5 lbs. a veterinarian is skeptical of this claim and takes a random sample of 15 labs that come into her clinic. the 15 labs have an average weight of 80 lbs. use the test statistic approach at the 5% level to test if the vet’s data suggests that our original belief is incorrect.

Answers: 1

Another question on Mathematics
Mathematics, 21.06.2019 17:30
Jacks bank statement shows an account balance of -$25.50. which describes the magnitude, of size, of the debt in dollars
Answers: 2
Mathematics, 21.06.2019 23:30
In an isosceles triangle, the vertex angle is 112 degrees. what is the measure of each base. a.34 b.24 c.44 d.54
Answers: 1
Mathematics, 22.06.2019 01:30
In 2000, for a certain region, 27.1% of incoming college freshman characterized their political views as liberal, 23.1% as moderate, and 49.8% as conservative. for this year, a random sample of 400 incoming college freshman yielded the frequency distribution for political views shown below. a. determine the mode of the data. b. decide whether it would be appropriate to use either the mean or the median as a measure of center. explain your answer. political view frequency liberal 118 moderate 98 conservative 184 a. choose the correct answer below. select all that apply. a. the mode is moderate. b. the mode is liberal. c. the mode is conservative. d. there is no mode.
Answers: 1
Mathematics, 22.06.2019 02:30
The upcoming championship high school football game is a big deal in your little town. the problem is, it is being played in the next biggest town, which is two hours away! to get as many people as you can to attend the game, you decide to come up with a ride-sharing app, but you want to be sure it will be used before you put all the time in to creating it. you determine that if more than three students share a ride, on average, you will create the app. you conduct simple random sampling of 20 students in a school with a population of 300 students to determine how many students are in each ride-share (carpool) on the way to school every day to get a good idea of who would use the app. the following data are collected: 6 5 5 5 3 2 3 6 2 2 5 4 3 3 4 2 5 3 4 5 construct a 95% confidence interval for the mean number of students who share a ride to school, and interpret the results. part a: state the parameter and check the conditions. part b: construct the confidence interval. be sure to show all your work, including the degrees of freedom, critical value, sample statistics, and an explanation of your process. part c: interpret the meaning of the confidence interval. part d: use your findings to explain whether you should develop the ride-share app for the football game.
Answers: 3
You know the right answer?
The average weight of a male labrador retriever is believed to be well-approximated by a normal dist...
Questions

History, 26.11.2021 22:40
Mathematics, 26.11.2021 22:40


Chemistry, 26.11.2021 22:40
Mathematics, 26.11.2021 22:40

Social Studies, 26.11.2021 22:40


Physics, 26.11.2021 22:40
Social Studies, 26.11.2021 22:40

SAT, 26.11.2021 22:40

English, 26.11.2021 22:40
Social Studies, 26.11.2021 22:40


