Hlp
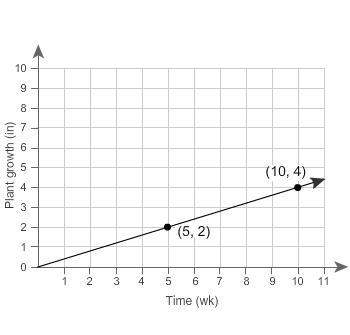
relationship b has a lesser rate than relationship a. this graph represents relationship a...

Mathematics, 10.10.2019 01:30 navarreteanamen123
Hlp
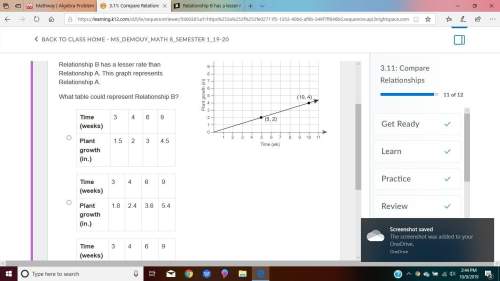
relationship b has a lesser rate than relationship a. this graph represents relationship a.
what table could represent relationship b?
a. time (weeks)
3 4 6 9
plant growth (in.)
1.5 2 3 4.5
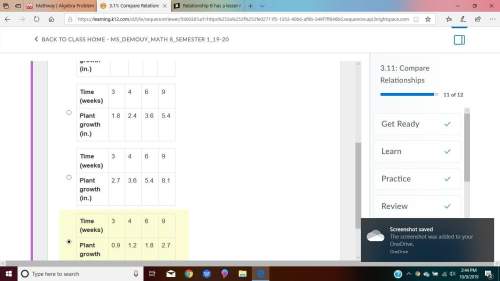
b. time (weeks)
3 4 6 9
plant growth (in.)
1.8 2.4 3.6 5.4
c. time (weeks)
3 4 6 9
plant growth (in.)
2.7 3.6 5.4 8.1
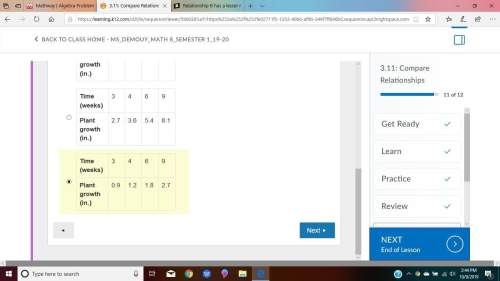
d. time (weeks)
3 4 6 9
plant growth (in.)
0.9 1.2 1.8 2.7

Answers: 1
Another question on Mathematics
Mathematics, 21.06.2019 14:20
Suppose a least-squares regression line is given by modifyingabove y with caret equals 4.302 x minus 3.293. what is the mean value of the response variable if xequals20?
Answers: 3
Mathematics, 21.06.2019 15:40
The data represents the semester exam scores of 8 students in a math course. {51,91,46,30,36,50,73,80} what is the five-number summary?
Answers: 1
Mathematics, 21.06.2019 17:00
In triangle opq right angled at p op=7cm,oq-pq=1 determine the values of sinq and cosq
Answers: 1
Mathematics, 21.06.2019 23:00
Charlie tosses five coins.what is the probability that all five coins will land tails up.
Answers: 2
You know the right answer?
Questions

Mathematics, 05.12.2020 01:00

Chemistry, 05.12.2020 01:00


English, 05.12.2020 01:00
Mathematics, 05.12.2020 01:00
Mathematics, 05.12.2020 01:00

Computers and Technology, 05.12.2020 01:00
Health, 05.12.2020 01:00
Mathematics, 05.12.2020 01:00

Advanced Placement (AP), 05.12.2020 01:00
English, 05.12.2020 01:00
Mathematics, 05.12.2020 01:00


