
question 3
plot a graph of height vs age given the data below.
age = (10, 12...

Mathematics, 03.10.2019 01:00 georgesarkes12
question 3
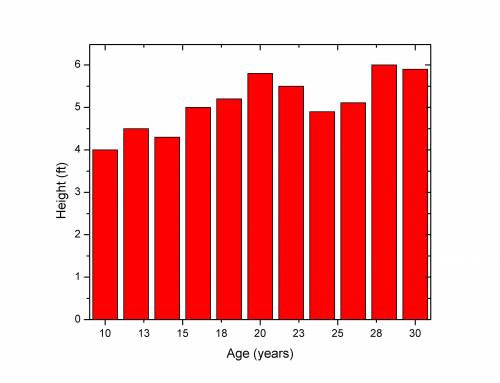
plot a graph of height vs age given the data below.
age = (10, 12, 14, 16, 18, 20, 22, 24, 26, 28, 30)
height = (4, 4.5, 4.3, 5, 5.2, 5.8, 5.5, 4.9, 5.11, 6, 5.9)
label the axis and chart. age is the x-axis and height the y-axis.
hint: use square brackets when assigning values to variables.

Answers: 3
Another question on Mathematics
Mathematics, 21.06.2019 22:00
The median am of triangle ∆abc is half the length of the side towards which it is drawn, bc . prove that triangle ∆abc is a right triangle, and find angle mac and abm
Answers: 1
Mathematics, 21.06.2019 22:50
1. if events a and b are non-overlapping events, how do you find the probability that one or the other occurs? 2. what does it mean if p(a or b) equals 1?
Answers: 2
Mathematics, 21.06.2019 23:30
(c) compare the results of parts (a) and (b). in general, how do you think the mode, median, and mean are affected when each data value in a set is multiplied by the same constant? multiplying each data value by the same constant c results in the mode, median, and mean increasing by a factor of c. multiplying each data value by the same constant c results in the mode, median, and mean remaining the same. multiplying each data value by the same constant c results in the mode, median, and mean decreasing by a factor of c. there is no distinct pattern when each data value is multiplied by the same constant. (d) suppose you have information about average heights of a random sample of airline passengers. the mode is 65 inches, the median is 72 inches, and the mean is 65 inches. to convert the data into centimeters, multiply each data value by 2.54. what are the values of the mode, median, and mean in centimeters? (enter your answers to two decimal places.) mode cm median cm mean cm in this problem, we explore the effect on the mean, median, and mode of multiplying each data value by the same number. consider the following data set 7, 7, 8, 11, 15. (a) compute the mode, median, and mean. (enter your answers to one (1) decimal places.) mean value = median = mode = (b) multiply 3 to each of the data values. compute the mode, median, and mean. (enter your answers to one (1) decimal places.) mean value = median = mode = --
Answers: 1
Mathematics, 22.06.2019 00:00
The graph shows the amount of money noah earned based on the number of lawns he cut. which list shows the dependent quantities in the graph?
Answers: 3
You know the right answer?
Questions

English, 20.06.2021 08:30
Mathematics, 20.06.2021 08:30

Business, 20.06.2021 08:30

Chemistry, 20.06.2021 08:30
Mathematics, 20.06.2021 08:30

Geography, 20.06.2021 08:30
Mathematics, 20.06.2021 08:30
English, 20.06.2021 08:40
Geography, 20.06.2021 08:40
Mathematics, 20.06.2021 08:40


Mathematics, 20.06.2021 08:40
Mathematics, 20.06.2021 08:40
Business, 20.06.2021 08:40


