Suppose that g(x) = f(x) - 4. which statement best compares the graph of
g(x) with the graph o...

Mathematics, 17.09.2019 01:00 emmalucilleblaha1995
Suppose that g(x) = f(x) - 4. which statement best compares the graph of
g(x) with the graph of fx)?

Answers: 1
Another question on Mathematics
Mathematics, 21.06.2019 16:00
Part one: measurements 1. measure your own height and arm span (from finger-tip to finger-tip) in inches. you will likely need some from a parent, guardian, or sibling to get accurate measurements. record your measurements on the "data record" document. use the "data record" to you complete part two of this project. name relationship to student x height in inches y arm span in inches archie dad 72 72 ginelle mom 65 66 sarah sister 64 65 meleah sister 66 3/4 67 rachel sister 53 1/2 53 emily auntie 66 1/2 66 hannah myself 66 1/2 69 part two: representation of data with plots 1. using graphing software of your choice, create a scatter plot of your data. predict the line of best fit, and sketch it on your graph. part three: the line of best fit include your scatter plot and the answers to the following questions in your word processing document 1. 1. which variable did you plot on the x-axis, and which variable did you plot on the y-axis? explain why you assigned the variables in that way. 2. write the equation of the line of best fit using the slope-intercept formula $y = mx + b$. show all your work, including the points used to determine the slope and how the equation was determined. 3. what does the slope of the line represent within the context of your graph? what does the y-intercept represent? 5. use the line of best fit to you to describe the data correlation.
Answers: 2
Mathematics, 22.06.2019 00:30
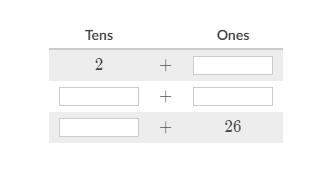
Long division setup showing an incomplete calculation. 12 is in the divisor, 6839 is in the dividend, and 5 hundreds and 6 tens is written in the quotient. 6000 is subtracted from 6839 to give 839. an unknown value represented by a box is being subtracted from 839. what number should be placed in the box to complete the division calculation?
Answers: 3
Mathematics, 22.06.2019 04:40
The discrete random variables x and y take integer values with joint probability distribution given by f (x,y) = a(y−x+1) 0 ≤ x ≤ y ≤ 2 or =0 otherwise, where a is a constant. 1 tabulate the distribution and show that a = 0.1.2 find the marginal distributions of x and y. 3 calculate cov(x,y).4 state, giving a reason, whether x and y are independent. 5 calculate e(y|x = 1).
Answers: 2
Mathematics, 22.06.2019 05:20
Say that a supplier claims they are 99% confident that their products will be in the interval of 50.02 to 50.38. you take samples and find that the 99% confidence interval of what they are sending is 50.00 to 50.36. what conclusion can be made? homework : 5vd. comparing sample confidence intervals with given intervals (links to an external site.)links to an external site. (3: 43) 5dc. confidence intervals in manufacturing, high vs low level of confidence, wide vs narrow (links to an external site.)links to an external site. (docx) the supplier is less accurate than they claimed the supplier products have a lower mean than claimed the supplier is more accurate than they claimed the supplier products have a higher mean than claimed
Answers: 2
You know the right answer?
Questions
Mathematics, 28.09.2019 22:00


Physics, 28.09.2019 22:00
Mathematics, 28.09.2019 22:00

History, 28.09.2019 22:00

Social Studies, 28.09.2019 22:00


Geography, 28.09.2019 22:00
Mathematics, 28.09.2019 22:00


