
Mathematics, 27.08.2019 13:30 tatumleigh04
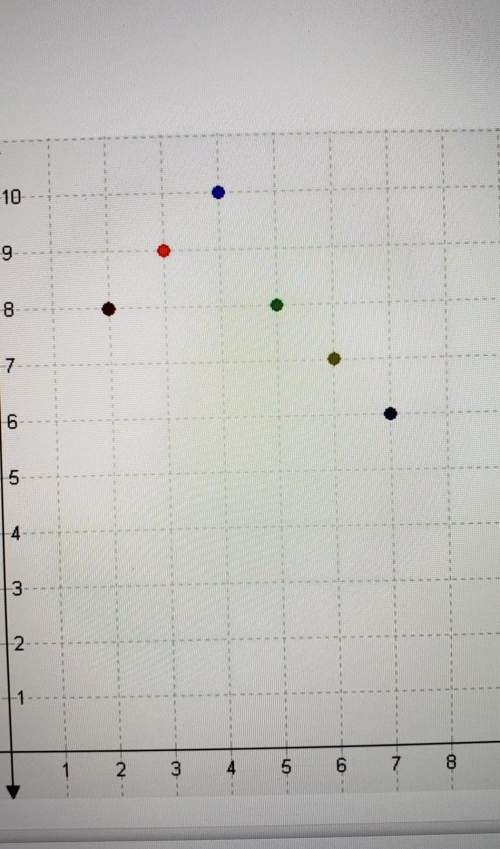
If lines joined each given point on the graph to the origin, which points would be on lines that represent a unit rate greater than the one represented in
the table?
10 22
15 33
2
3
4
5
6
7
8
0
10

Answers: 2
Another question on Mathematics
Mathematics, 21.06.2019 21:00
The sum of the first eight terms of an arithmetic progression is 9m + 14. the fifth term of the06 progression is 2m - 6, where m is a constant.given that the first term of the progression is 26,find the value of the common difference, d and thevalue of m.
Answers: 1
Mathematics, 21.06.2019 23:30
The table shows the number of hours orlando spent at football practice last week. select the appropriate numbers below to complete the model to find the number of hours orlando spent practicing on tuesday and friday.
Answers: 2
Mathematics, 22.06.2019 01:00
Asandwich shop has 18 tables. each table seats up to 4 people. to find the greatest number of people that can be seated, you can solve p4 ≤ 18. which step is the best way to solve the inequality? plz asap i repeat plz
Answers: 2
Mathematics, 22.06.2019 03:00
Describe how the presence of possible outliers might be identified on the following. (a) histograms gap between the first bar and the rest of bars or between the last bar and the rest of bars large group of bars to the left or right of a gap higher center bar than surrounding bars gap around the center of the histogram higher far left or right bar than surrounding bars (b) dotplots large gap around the center of the data large gap between data on the far left side or the far right side and the rest of the data large groups of data to the left or right of a gap large group of data in the center of the dotplot large group of data on the left or right of the dotplot (c) stem-and-leaf displays several empty stems in the center of the stem-and-leaf display large group of data in stems on one of the far sides of the stem-and-leaf display large group of data near a gap several empty stems after stem including the lowest values or before stem including the highest values large group of data in the center stems (d) box-and-whisker plots data within the fences placed at q1 â’ 1.5(iqr) and at q3 + 1.5(iqr) data beyond the fences placed at q1 â’ 2(iqr) and at q3 + 2(iqr) data within the fences placed at q1 â’ 2(iqr) and at q3 + 2(iqr) data beyond the fences placed at q1 â’ 1.5(iqr) and at q3 + 1.5(iqr) data beyond the fences placed at q1 â’ 1(iqr) and at q3 + 1(iqr)
Answers: 1
You know the right answer?
If lines joined each given point on the graph to the origin, which points would be on lines that rep...
Questions

Physics, 26.11.2020 05:20

Mathematics, 26.11.2020 05:20
Mathematics, 26.11.2020 05:20

English, 26.11.2020 05:20

Geography, 26.11.2020 05:20

Biology, 26.11.2020 05:20
Mathematics, 26.11.2020 05:20

Arts, 26.11.2020 05:20
Mathematics, 26.11.2020 05:20
Biology, 26.11.2020 05:20


