
Mathematics, 12.08.2019 01:10 maheshwarlall
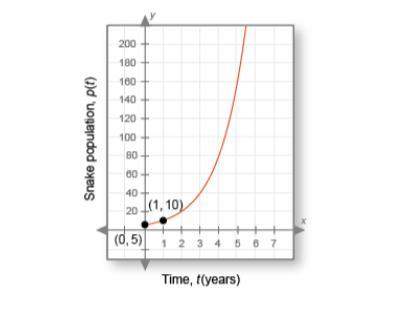
1. is this graph increasing or decreasing? does this imply that the boa constrictor is growing or diminishing?
2.looking at this graph, would you agree that the boa constrictor population could become a problem?
3. what is the horizontal asymptote of this graph?
4. what is the domain? explain.
5. what is the range? explain.
6. what is the y intercept? what does this mean in terms of the snake population?
7. what is the point on the graph when x 1? what does this mean in terms of the snake population?
8. the graph is of a function in the form p(t) = a ⋅ b^t. what is the function?

Answers: 3
Another question on Mathematics
Mathematics, 21.06.2019 14:00
What is the logarithmic function modeled by the following table? x f(x) 9 2 27 3 81 4
Answers: 2
Mathematics, 21.06.2019 19:30
Richard save $32 in march he saved $48 in april and $38 in may then richard spent $113 on a keyboard how much money does richard have left
Answers: 1
Mathematics, 22.06.2019 00:40
Astock has a 25% probability of increasing by $10 and a 75% probability of decreasing by $5. what is the stocks expected increase or decrease?
Answers: 1
Mathematics, 22.06.2019 01:30
This graph shows a portion of an odd function. use the graph to complete the table of values. x f(x) −2 −3 −4 −6 im sorry i cant get the graph up
Answers: 1
You know the right answer?
1. is this graph increasing or decreasing? does this imply that the boa constrictor is growing or d...
Questions

Business, 26.03.2021 02:10

Mathematics, 26.03.2021 02:10
Mathematics, 26.03.2021 02:10
Mathematics, 26.03.2021 02:10

History, 26.03.2021 02:10
Mathematics, 26.03.2021 02:10
Mathematics, 26.03.2021 02:10
Mathematics, 26.03.2021 02:10

Chemistry, 26.03.2021 02:10

Social Studies, 26.03.2021 02:10
Chemistry, 26.03.2021 02:10


