
Mathematics, 12.11.2019 04:31 slippedsumo
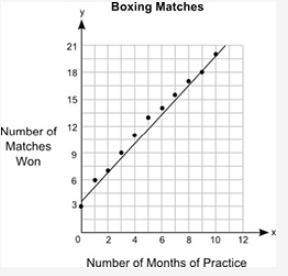
The graph below shows the relationship between the number of months different students practiced boxing and the number of matches they won:
part a: what is the approximate y-intercept of the line of best fit and what does it represent? (5 points)
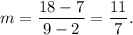
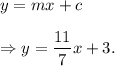
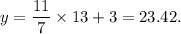
part b: write the equation for the line of best fit in the slope-intercept form and use it to predict the number of matches that could be won after 13 months of practice. show your work and include the points used to calculate the slope. (5 points)

Answers: 2
Another question on Mathematics
Mathematics, 21.06.2019 18:30
Select the lengths in centimeters that would form a right triangle
Answers: 1
Mathematics, 21.06.2019 20:30
Create a question with this scenario you could ask that could be answered only by graphing or using logarithm. david estimated he had about 20 fish in his pond. a year later, there were about 1.5 times as many fish. the year after that, the number of fish increased by a factor of 1.5 again. the number of fish is modeled by f(x)=20(1.5)^x.
Answers: 1
Mathematics, 21.06.2019 20:30
Give the functions f(x) = |x + 2| - 3, what is the domain? a,b,c, or d all real numbers x > 2 x < -2 all real numbers and x cannot equal to 2
Answers: 1
You know the right answer?
The graph below shows the relationship between the number of months different students practiced box...
Questions

Computers and Technology, 09.10.2019 10:10
Mathematics, 09.10.2019 10:10

Chemistry, 09.10.2019 10:10


World Languages, 09.10.2019 10:10
Mathematics, 09.10.2019 10:10


History, 09.10.2019 10:10
Computers and Technology, 09.10.2019 10:10
Mathematics, 09.10.2019 10:10
Mathematics, 09.10.2019 10:10

Health, 09.10.2019 10:10

English, 09.10.2019 10:10


