
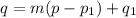
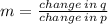
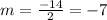
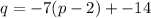
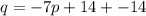
which function rule would you find the values in the table
p 2, 4, 6, 8
q -14, -28, -42...

Mathematics, 28.01.2020 12:31 hoodricchkeyy
which function rule would you find the values in the table
p 2, 4, 6, 8
q -14, -28, -42, -56
a. q = -7p
b. q = p - 7
c. q = - 14p
d. q = p - 14

Answers: 2
Another question on Mathematics
Mathematics, 21.06.2019 13:30
Malia is observing the velocity of a cyclist at different times. after two hours, the velocity of the cyclist is 15 km/h. after five hours, the velocity of the cyclist is 12 km/h. part a: write an equation in two variables in the standard form that can be used to describe the velocity of the cyclist at different times. show your work and define the variables used. (5 points) part b: how can you graph the equations obtained in part a for the first 12 hours? (5 points) if you can try and make this as little confusing as you can
Answers: 2
Mathematics, 21.06.2019 19:00
Draw a scaled copy of the circle using a scale factor of 2
Answers: 1
Mathematics, 22.06.2019 00:00
Determine the function’s value when x = -1 a. g(-1)=-3 b. g(-1)=0 c. g(-1)=1 d. g(-1)=27
Answers: 2
Mathematics, 22.06.2019 02:30
Atrain traveled for 1.5 hours to the first station, stopped for 30 minutes, then traveled for 4 hours to the final station where it stopped for 1 hour. the total distance traveled is a function of time. which graph most accurately represents this scenario? a graph is shown with the x-axis labeled time (in hours) and the y-axis labeled total distance (in miles). the line begins at the origin and moves upward for 1.5 hours. the line then continues upward at a slow rate until 2 hours. from 2 to 6 hours, the line continues quickly upward. from 6 to 7 hours, it moves downward until it touches the x-axis a graph is shown with the axis labeled time (in hours) and the y axis labeled total distance (in miles). a line is shown beginning at the origin. the line moves upward until 1.5 hours, then is a horizontal line until 2 hours. the line moves quickly upward again until 6 hours, and then is horizontal until 7 hours a graph is shown with the axis labeled time (in hours) and the y-axis labeled total distance (in miles). the line begins at the y-axis where y equals 125. it is horizontal until 1.5 hours, then moves downward until 2 hours where it touches the x-axis. the line moves upward until 6 hours and then moves downward until 7 hours where it touches the x-axis a graph is shown with the axis labeled time (in hours) and the y-axis labeled total distance (in miles). the line begins at y equals 125 and is horizontal for 1.5 hours. the line moves downward until 2 hours, then back up until 5.5 hours. the line is horizontal from 5.5 to 7 hours
Answers: 1
You know the right answer?
Questions

Business, 11.08.2021 14:00
Mathematics, 11.08.2021 14:00
Business, 11.08.2021 14:00
Mathematics, 11.08.2021 14:00
Business, 11.08.2021 14:00
Mathematics, 11.08.2021 14:00


Physics, 11.08.2021 14:00
Physics, 11.08.2021 14:00
Mathematics, 11.08.2021 14:00

English, 11.08.2021 14:00

Mathematics, 11.08.2021 14:00


