
Mathematics, 23.09.2019 14:30 kee387
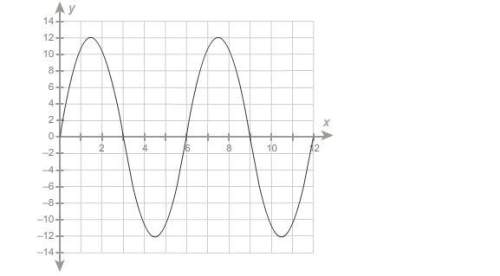
The graph shows the vertical displacement y, in inches, that a weight bouncing from a spring world achieve if there were no friction, for the given number of seconds x,
what is the graph frequency?
question 1 options:
a. 1/3
b.1/6
c.6
d.12

Answers: 1


Another question on Mathematics
Mathematics, 21.06.2019 16:40
The graph of which equation includes the points (0, 10) and (10, 11)? y = 10x + 11 y = x + 10 y= 1/10x + 10 y = 1/10x + 11
Answers: 1
Mathematics, 22.06.2019 02:30
An engineer is going to redesign an ejection seat for an airplane. the seat was designed for pilots weighing between 120 lb and 161 lb. the new population of pilots has normally distributed weights with a mean of 125 lb and a standard deviation of 28.1 lb. a)if a pilot is randomly selected, find the probability that his weight is between 120 lb and 161 lb.the probability is approximately? b. if 36 different pilots are randomly selected, find the probability that their mean weight is between 120 lb and 161 lb. the probability is approximately? c. when redesigning the ejection seat, which probability is more relevant? . part (b) because the seat performance for a single pilot is more important. b. part (b) because the seat performance for a sample of pilots is more important. c. part (a) because the seat performance for a sample of pilots is more important. d. part (a) because the seat performance for a single pilot is more important.
Answers: 3
Mathematics, 22.06.2019 02:30
Find the combined area of the triangles. click on the answer until the correct answer is showing.possible answers: a = 4 pi - 8a = 9 pi - 9/2 √3a = 16/3 pia = 16a = 27 pi
Answers: 1
Mathematics, 22.06.2019 09:00
Iwill mark brainliest worth 30 pointsthe distance, y, in centimeters, of an ant from a hole in the tree for a certain amount of time, x, in seconds, is shown in the graph: a graph titled motion of ant is shown. the graph shows time in seconds on the x-axis and the distance from hole in centimeters on the y-axis. the scale on the x-axis is shown from 0 to 6 at increments of 1, and the scale on the y-axis is shown from 0 to 12 at increments of 2. the graph has 3 straight lines. the first line is labeled p and joins ordered pairs 0, 0 and 2, 6. the second line is labeled q and joins ordered pairs 2, 6 and 3, 6. the third line is labeled r and joins ordered pairs 3, 6 and 5, 0.part a: is the graph linear or nonlinear? explain your answer. (2 points)part b: in which segments is the graph increasing, decreasing, and constant? (3 points)part c: in your own words, describe the motion of the ant, as shown on the graph. (5 points)
Answers: 1
You know the right answer?
The graph shows the vertical displacement y, in inches, that a weight bouncing from a spring world a...
Questions

Biology, 23.11.2020 16:40

Mathematics, 23.11.2020 16:40
Mathematics, 23.11.2020 16:40
Mathematics, 23.11.2020 16:40

Geography, 23.11.2020 16:40


Chemistry, 23.11.2020 16:40

World Languages, 23.11.2020 16:40

Mathematics, 23.11.2020 16:40
Mathematics, 23.11.2020 16:40


