
Mathematics, 05.10.2019 04:00 jeremiaht7
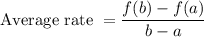
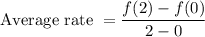
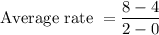
What is the average rate of change of f(x), represented by the graph, over the interval [0, 2]?
a. 2
b. 1
c. 0.5
d. -0.5
![What is the average rate of change of f(x), represented by the graph, over the interval [0, 2]?](/tpl/images/09/03/mGNMi6NaL8vTJomc.jpg)

Answers: 2

Another question on Mathematics
Mathematics, 21.06.2019 13:40
Which compound inequality can be used to solve the inequality 3x+2 > 7? -7 < 3x+2> 7 -7> 3x+27 3x + 2 > -7 or 3x + 2 > 7 3x + 2 < -7 or 3x + 2 > 7
Answers: 1
Mathematics, 21.06.2019 18:30
Do some research and find a city that has experienced population growth. determine its population on january 1st of a certain year. write an exponential function to represent the city’s population, y, based on the number of years that pass, x after a period of exponential growth. describe the variables and numbers that you used in your equation.
Answers: 3
Mathematics, 21.06.2019 23:30
Which of the following exponential functions goes through the points (1, 6) and (2, 12)? f(x) = 3(2)x f(x) = 2(3)x f(x) = 3(2)−x f(x) = 2(3)−x
Answers: 1
Mathematics, 22.06.2019 00:00
Find the length of the normal and the angle it makes with the positive x-axis. (see pictured below)
Answers: 1
You know the right answer?
What is the average rate of change of f(x), represented by the graph, over the interval [0, 2]?
Questions
Mathematics, 26.03.2020 01:56


Mathematics, 26.03.2020 01:57

Spanish, 26.03.2020 01:57
Mathematics, 26.03.2020 01:57

English, 26.03.2020 01:57
Mathematics, 26.03.2020 01:57

Mathematics, 26.03.2020 01:57

Biology, 26.03.2020 01:57
Mathematics, 26.03.2020 01:57
Mathematics, 26.03.2020 01:57
English, 26.03.2020 01:57


