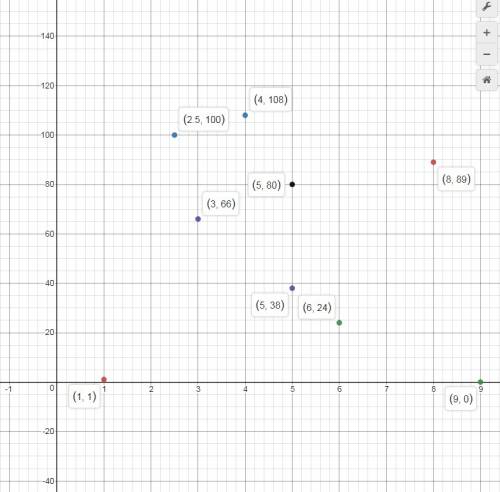
Which association best describes the data in the table?
variable x 1 9 3 5 5 8 2.5 4 6...

Mathematics, 07.12.2019 00:31 janeou17xn
Which association best describes the data in the table?
variable x 1 9 3 5 5 8 2.5 4 6
variable y 1 0 66 80 38 89 100 108 24
a. positive nonlinear association
b. positive association
c. no association
d. negative linear association

Answers: 3
Another question on Mathematics
Mathematics, 21.06.2019 15:00
1. there are 25 students who started computer programming in elementary school and 25 students who started computer programming in middle school. the first group had a mean final project grade of 95% and the second group had a mean final project grade of 92%. the line plot shows the differences after 10 rerandomizations. determine whether the difference in the means of the two groups is significant based on the line plot. explain your answer.
Answers: 1
Mathematics, 21.06.2019 19:00
Billy plotted −3 4 and −1 4 on a number line to determine that −3 4 is smaller than −1 4 is he correct? explain why or why not?
Answers: 3
Mathematics, 21.06.2019 20:00
Seymour is twice as old as cassandra. if 16 is added to cassandra’s age and 16 is subtracted from seymour’s age, their ages become equal. what are their present ages? show !
Answers: 1
You know the right answer?
Questions

Mathematics, 03.03.2020 23:52

Business, 03.03.2020 23:52


Chemistry, 03.03.2020 23:52
Mathematics, 03.03.2020 23:52
Mathematics, 03.03.2020 23:53
Mathematics, 03.03.2020 23:53
Mathematics, 03.03.2020 23:53


Mathematics, 03.03.2020 23:53


