y = -3x
Step-by-step explanation:
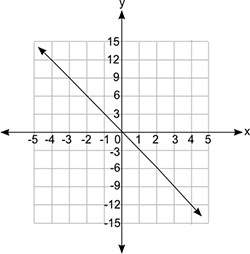
Given the illustration of the graph, we can see that the line is going downhill. This would indicate that the slope is negative, so the choices would be narrowed down y = -3x or y = -x. Looking at the line, we can use two points to find the difference in 'y' over the difference in 'x', or slope. Using the origin (0,0) as one point, we can go down 3 and over 1 to get to the second point of (1, -3). This would be an overall change of -3, giving us the final answer of:
y = -3x