
Mathematics, 01.07.2019 21:30 KnMcdonaldk93906
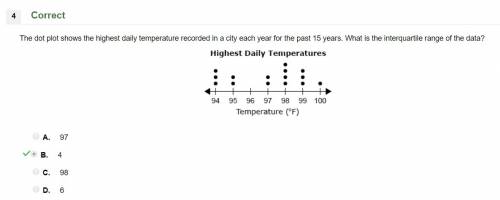
The dot plot shows the highest daily temperature recorded in a city each year for the past 15 years. what is the interquartile range of the data? a. 97 b. 4 c. 6 d. 98

Answers: 1
Another question on Mathematics
Mathematics, 21.06.2019 17:30
How many bananas are in a fruit bowl that has 200 total apples and bananas if there are 31 bananas for every 93 apples
Answers: 1
Mathematics, 21.06.2019 18:00
Fanny mendelssohn manages all the magazines and paperback books at a local grocery store. she prices many paperbacks to sell at $7.99. the cost to the store is $5.29. what is the markup rate on a paperback book, based on its cost?
Answers: 1
Mathematics, 21.06.2019 19:30
Runner ran 1 4/5 miles on monday and 6 3/10 on tuesday. how many times her monday’s distance was her tuesdays distance
Answers: 1
Mathematics, 21.06.2019 20:30
List x1, x2, x3, x4 where xi is the left endpoint of the four equal intervals used to estimate the area under the curve of f(x) between x = 4 and x = 6. a 4, 4.5, 5, 5.5 b 4.5, 5, 5.5, 6 c 4.25, 4.75, 5.25, 5.75 d 4, 4.2, 5.4, 6
Answers: 1
You know the right answer?
The dot plot shows the highest daily temperature recorded in a city each year for the past 15 years....
Questions


Biology, 20.09.2019 18:30

Spanish, 20.09.2019 18:30

English, 20.09.2019 18:30
Spanish, 20.09.2019 18:30
English, 20.09.2019 18:30

Engineering, 20.09.2019 18:30

World Languages, 20.09.2019 18:30
History, 20.09.2019 18:30


