
Mathematics, 24.09.2019 00:00 niescarlosj
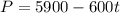
3. a town's population has been decreasing at a constant rate, in 2010, the population was 5,900 by 2012 the population jad dropped to 4,700 assume the tren contiues
a. predict te population in 2016
b. identify the year in which the population will reach 0
4. a town has an initial population of 75,000. it grows at a constant rate of 2,500 per year for five year
a. find the linear function that models the town's population p as a function of the year, t where t is the number of years since the model began
b. graph y==p(t) interpret the meaning of the intercepts.
c. when does the model expect the population to reach 100,000?
5. the weight of a newborn baby is 7.5 pounds. the baby gained one-half pound a month in its first year.
a. find the linear function that models the baby's weight w as a function of the age of the baby t, in months
b. fine a reasonable domain and range for the function w

Answers: 1


 .
.

 years
years

 is the initial population


 .
.  .
.

 .
. 
 is the initial weight in pounds
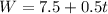


Another question on Mathematics
Mathematics, 21.06.2019 16:30
Why do interests rates on loans to be lower in a weak economy than in a strong one
Answers: 3
Mathematics, 21.06.2019 21:00
Select the correct answer from each drop-down menu. a system of equations and its solution are given below. system a complete the sentences to explain what steps were followed to obtain the system of equations below. system b to get system b, the equation in system a was replaced by the sum of that equation and times the equation. the solution to system b the same as the solution to system a.]
Answers: 1
Mathematics, 22.06.2019 02:30
Use stokes' theorem to evaluate c f · dr where c is oriented counterclockwise as viewed from above. f(x, y, z) = xyi + 5zj + 7yk, c is the curve of intersection of the plane x + z = 8 and the cylinder x2 + y2 = 81.
Answers: 2
Mathematics, 22.06.2019 04:30
People end up tossing 12% of what they buy at the grocery store. assume this is the true population proportion and that you plan to take a sample survey of 540 grocery shoppers to further investigate their behavior. a. calculate the mean and the standard error for the sample proportion p. b. describe the sampling distribution of p in part a. draw a graph of this probability distribution with its mean and standard deviation. what is the probability that your survey will provide a sample proportion more than 15%? c. d. population proportion? what is the probability that your survey will provide a sample proportion within + 0.03 of the
Answers: 2
You know the right answer?
3. a town's population has been decreasing at a constant rate, in 2010, the population was 5,900 by...
Questions
Mathematics, 21.12.2020 21:40

English, 21.12.2020 21:40
Mathematics, 21.12.2020 21:40

Mathematics, 21.12.2020 21:40
Mathematics, 21.12.2020 21:40

Chemistry, 21.12.2020 21:40
Mathematics, 21.12.2020 21:40


English, 21.12.2020 21:40
English, 21.12.2020 21:40

Spanish, 21.12.2020 21:40

Biology, 21.12.2020 21:40


