
Mathematics, 21.11.2019 04:31 jumpgirll
Ineed math ! i don't understand this assignment at all! it has 5 parts, the first four are charts or graphs i have to fill out and the last one is written reflection of the first four. i'll insert pictures.
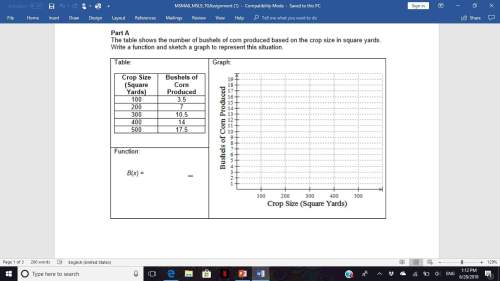
part a
the table shows the number of bushels of corn produced based on the crop size in square yards. write a function and sketch a graph to represent this situation. (see 1st picture) - just tell me what to write for the function, and the coordinates for the sketch
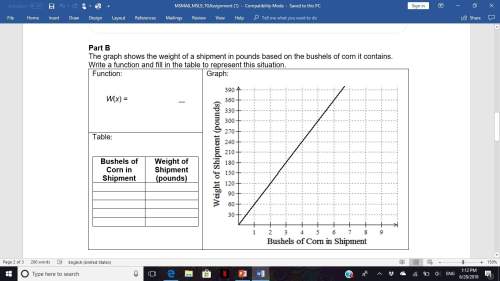
part b
the graph shows the weight of a shipment in pounds based on the bushels of corn it contains.
write a function and fill in the table to represent this situation. (see 2nd picture) - tell me what to write in the table, and what to write for the function
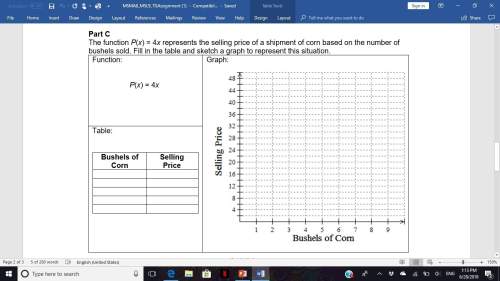
part c
the function p(x) = 4x represents the selling price of a shipment of corn based on the number of bushels sold. fill in the table and sketch a graph to represent this situation. (see 3rd picture) - tell me what to write in the table, and the coordinates for the sketch on the graph
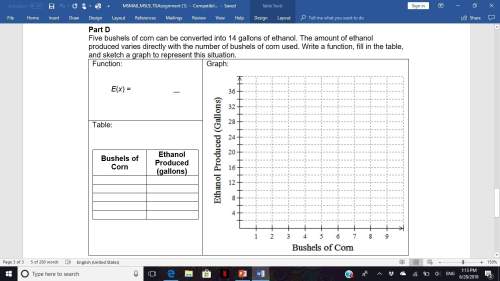
part d
five bushels of corn can be converted into 14 gallons of ethanol. the amount of ethanol produced varies directly with the number of bushels of corn used. write a function, fill in the table, and sketch a graph to represent this situation. (see 4th picture) - this one's really confusing, tell me the function, what to put in the tale, and the coordinates for the sketch on the graph
part e
look back at all of these examples of direct linear variation which are proportional relationships. what common characteristics do they have to distinguish them from non-proportional relationships? what distinguishes their equations from non-proportional relationships?
if you do , you. if you can't , don't answer anything. answers only . late answers welcome, because better late than never.
||45 points||

Answers: 2
Another question on Mathematics
Mathematics, 21.06.2019 17:10
How many lines can be drawn through points j and k? 0 1 2 3
Answers: 2
Mathematics, 21.06.2019 18:30
Aswimming pool had 2.5 million liters of water in it. some water evaporated, and then the pool only had 22 million liters of water in it. what percent of the water evaporated?
Answers: 1
Mathematics, 21.06.2019 19:30
You have learned about the six trigonometric functions, their definitions, how to use them, and how to represent them graphically. the sine, cosine, and tangent trigonometric functions can be paired with their reciprocal functions, cosecant, secant, and cotangent, respectively. think about how each function is related to its reciprocal function.how are the graphs of the reciprocal functions related to their corresponding original functions? what happens to the graphs of the reciprocal functions as x approaches the zeros of the original functions? describe how you would teach friends with different learning styles (visual-spatial, aural-auditory, verbal-linguistic, physical-bodily-kinesthetic, logical-mathematical, social-interpersonal, and solitary-intrapersonal) how to graph the reciprocal functions
Answers: 2
You know the right answer?
Ineed math ! i don't understand this assignment at all! it has 5 parts, the first four are charts...
Questions

Mathematics, 27.09.2019 08:10
Mathematics, 27.09.2019 08:10

Chemistry, 27.09.2019 08:10


Mathematics, 27.09.2019 08:10


History, 27.09.2019 08:10
Chemistry, 27.09.2019 08:10
Chemistry, 27.09.2019 08:10
Biology, 27.09.2019 08:10

Health, 27.09.2019 08:10
Mathematics, 27.09.2019 08:10


